
Jira Align, Atlassian’s enterprise-grade Agile solution, has offered a degree of capacity planning since its initial release. But a number of recent improvements have made this key feature much more user-friendly, powerful, and flexible. In this post, we’ll cover what five recent upgrades that make capacity planning in Jira Align better than ever.
Jira Align’s five fundamental work items, along with all the built-in laddered work management and reporting features, are central to providing flexibility in managing Agile work at different altitudes.
For starters, the existing Forecast page now works for the Feature level, in addition to Epic and Capability. And capacity planning now has its own page—Capacity—that uses the data from the Forecast page, which, in turn, displays data from the Capacity page.
Forecast Page
Work forecasting has been available at the Epic and Capability level since the initial release, and now it’s also available for Feature work items. Here are the three key updates.
Capacity Remaining
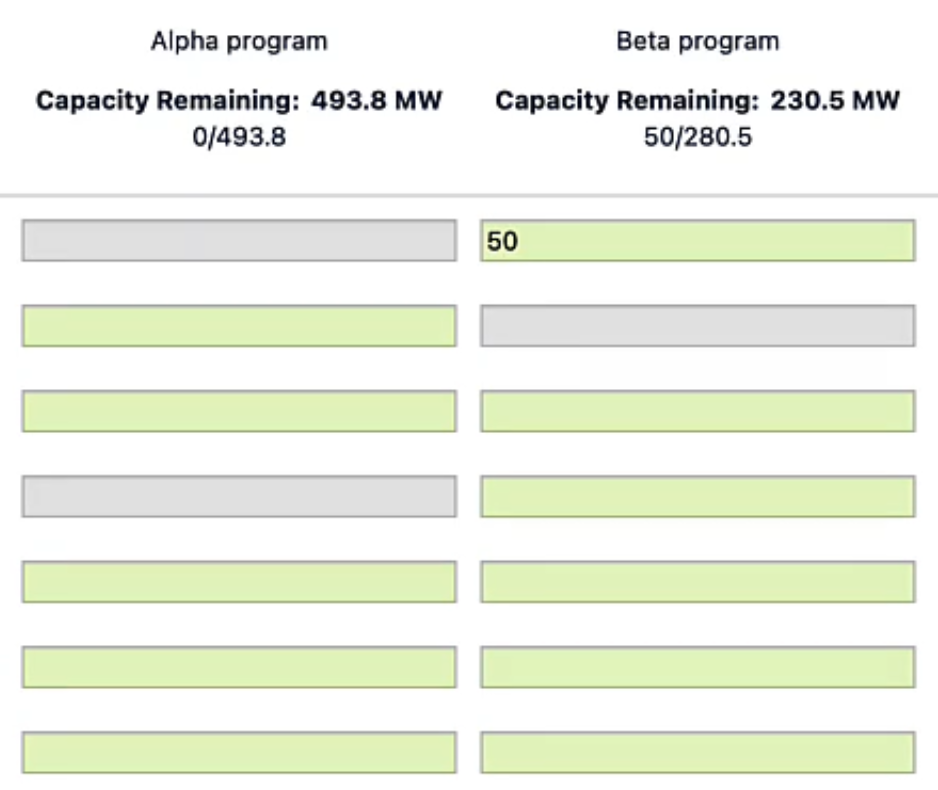
If you’re using the Capacity page (see section below), your capacity data will appear on the Forecast page at the top of each program column, so you can easily avoid committing to more work than you can accomplish.
Automatic Math
Estimating for a given Epic/Capability/Feature now includes buttons that automatically add up the estimations for each program and team, as well as for the entire Program Increment. You can still do it manually if you like, but now Align will do the math for you if you don’t.

Forecasted Spend
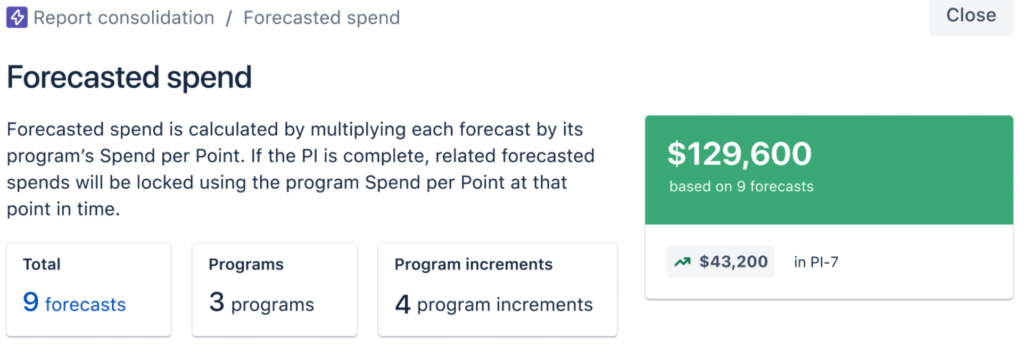
The Forecasted Spend financial value has been added to Features—in the Spend tab inside the Details panel for the work item—just as it has been for Epics and Capabilities.
Capacity Page
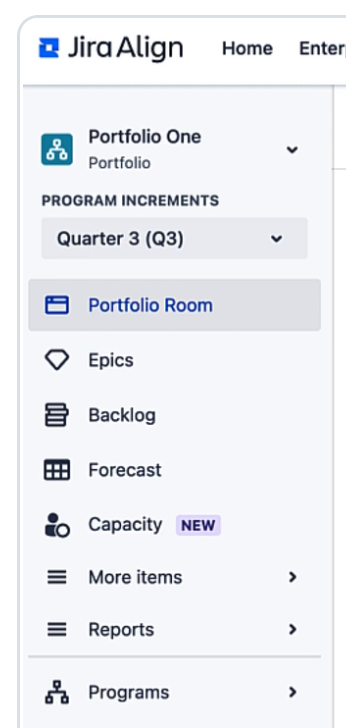
The Capacity page is a new feature, located just below Forecast in the left sidebar.
It is available in Portfolio, Solution, or Program context.

There are two sections on the page, Plan Summary and Plan Details.
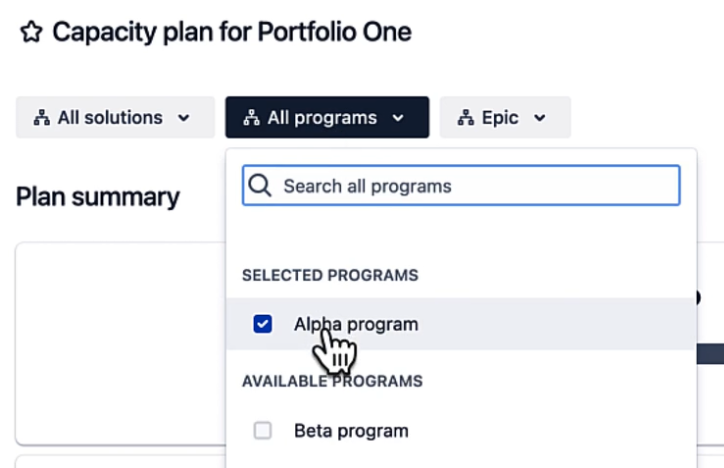
Plan Summary
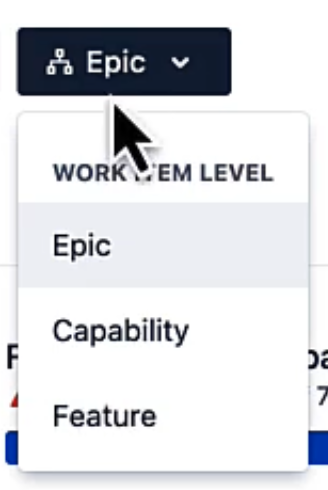
Just like with the Forecast page, you can choose the scope of planning. Choose a subset of the Solutions (if you chose the Solution context), a subset of the Programs, and/or set the work item level to Epic, Capacity, or Feature.
Once you’ve set the scope you want to plan for, the Forecast vs. Capacity bar shows you, at a glance, the plan’s total capacity, forecasted work, and current capacity remaining.

And the Forecast page is just a click away—just use the Source link to the right of the bar. This keeps the two halves of capacity planning in Jira Align conveniently connected.
The last part of the Plan Summary section contains six cards that each display an aggregated sum of all team-level data for the plan scope you’ve selected, showing you how the plan’s total capacity is calculated, along with the same calculations for the previous plan. The data calculated in the first four cards depends on whether you’re using points or member weeks. Here’s an example using points.

These cards update in real time as you plan to help you understand how the changes you make to plan details are affecting your capacity.
Two of the columns need a bit of explanation. Buffer, whether you’re using points or weeks, provides a way to capture factors like planned PTO that reduce the amount of effort the team can put in for the plan’s duration. Capacity Percentage captures how much of the team’s work time will go toward this plan, which is vital because team members may have a certain amount of overhead in their days, or their time may be split between projects. The program’s Buffer value is subtracted before the Capacity Percentage is applied. For example:
20 points per sprint x 6 sprints = 120 points
120 points - 20 points of buffer = 100 points
Capacity % of 80 x 100 points = Available capacity of 80 points
Plan Details
This table breaks down the data in the cards, with the programs or teams as rows, and the same six factors as columns. Initially each program in the plan is a row, to provide an overview.
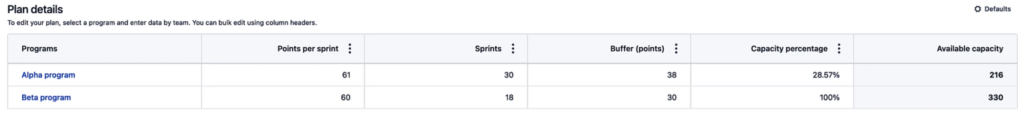
If you want to apply values to all listed programs in the plan, use the three-dot pop-up menu in a column’s header to do so. See below for explanations of these editing options.
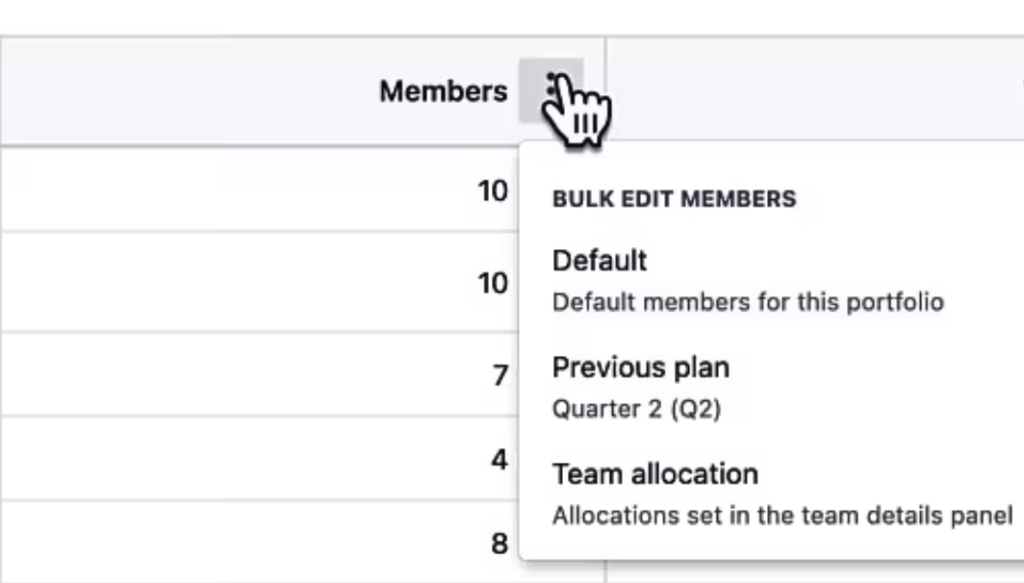
If you want to set different values for each program, or for each cell in a column, you do that at the team level; simply click on a program to pull up the team breakdown and directly edit the members, team capacity percentage, and so on. Changes are applied in real time, and are available in other places, like at the top of each program’s column in the Forecast page.
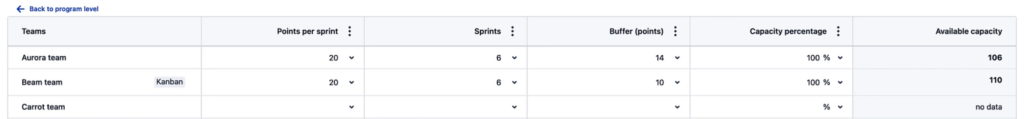
The Available Capacity column is calculated using the values in each row, and you can use the little down arrows in each cell to choose how you want to populate the value for that cell:
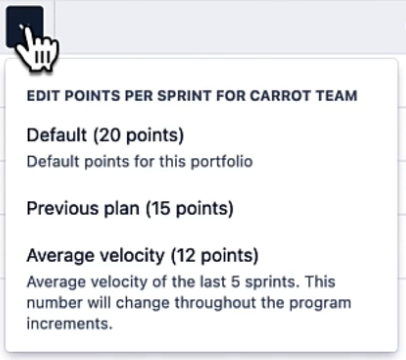
- Manual entry – just type in the value.
- Default value – use the Solution or Portfolio’s default value, which can be set using the Defaults link above the Available Capacity column.
- Previous value – use the corresponding value from the previous plan.
If you’re already using Jira Align, be sure to take advantage of the new capacity planning features we’ve covered here. If you’re considering Jira Align, Oxalis can help. We’ll assess the fit, design and prepare an implementation, then execute and support it. We’re an Atlassian Platinum Solutions Provider and offer premium consultation for Atlassian implementation services.