This article covers how to be more effective at individual and team planning, and how to streamline your project workflows across departments. We’ll discover two approaches to resource capacity planning, and outline the strategies, benefits, and best practices for each. Everything discussed here can be scaled, helping your enterprise function at premiere performance. See how applying effective resource capacity planning can ensure seven instantaneous benefits your business can utilize to function at peak performance.
Table of contents
The Challenge of Effective Resource Capacity Planning
Identify what you really need to know
On a basic level, capacity planning is an obvious need. You don’t want employees tasked with so much work that some of it goes unfinished, and you don’t want employees with too much idle time – especially if others are overworked. How do you find a balance? Companies are looking for solutions to help streamline this flux of workflow. Resolving capacity problems and implementing effective solutions will help your business deliver projects on time and continue to conduct business without workflow interruptions.
Because your organization is unique, you need to be clear on what level of resource capacity planning you’re already doing, and what you aren’t. Let’s look at the following scenarios to help clarify this a bit further.
Even in the latter case, you still need to identify which problems you’re most concerned about. Consider whether it would be more useful to group your employees by team, department, role, key skillset, etc. That grouping will affect a lot of the reporting options we’ll be looking at. If you skip this step, it’ll be hard to choose the right tools or know-how to make effective use of the data they give you.
Determine which tool(s) to use
There are, obviously, plenty of tools that either include resource capacity planning as a feature or focus on it exclusively.
Two key aspects to consider when selecting a tool are:
Capture the right data
There are several capacity-related elements you may want to report on, such as the team an individual belongs to, and what projects they’re working on. You don’t want to choose a tool that ignores teams if you want to see a capacity for your team.
Present the data so it tells you what you need to know
Capacity planning is about data – the number of hours employees are allocated to various projects and the hours they worked on those projects. That data can, with the right tools, be displayed in a wide variety of ways. Each of those displays tells a different story, and you want to make sure you hear the stories you need to hear.
Two Approaches to Resource Capacity Planning
The two fundamental approaches to capacity planning are team-based and individual-based. Most organizations will need a combination of the two, but it’s important to understand them separately. We’ll run through how each works using Jira and our favorite tools.
Individual-based Planning and Capacity
This approach probably doesn’t need much explanation, since even a small organization will find it useful to plan each employee’s workload. In order to support individual-based capacity planning with Jira, you’ll need some Atlassian Marketplace addons. Here we’ll cover using Tempo (with Tempo Planner and Tempo Timesheets) plus EazyBI to display the data as we need it.
What You Get with Tempo
Planning
Tempo Planner gives you a number of options for viewing planning data.
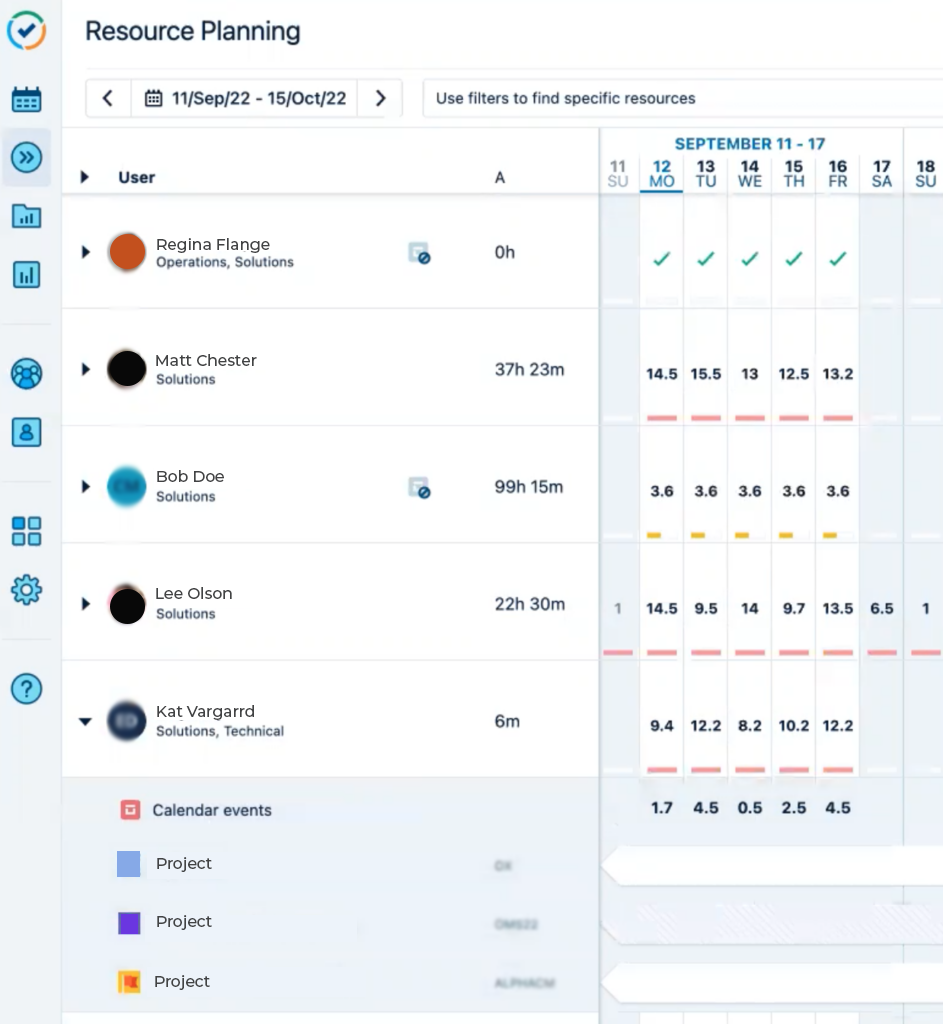
Here we see the Resource Planning view.
Each row is a resource, labeled with the Tempo team(s) they belong to, and a column for each day. A red bar in a table cell indicates that the resource has more hours planned for that day than they have capacity, while yellow means they have spare capacity. By default, the allocated hours for each resource are summed across all projects, but you can expand a resource to see their allocation by project. And this is more than a report – you can add planned hours right in the screen.
It’s easy to change the displayed time period, and you can use filters to show only certain resources.
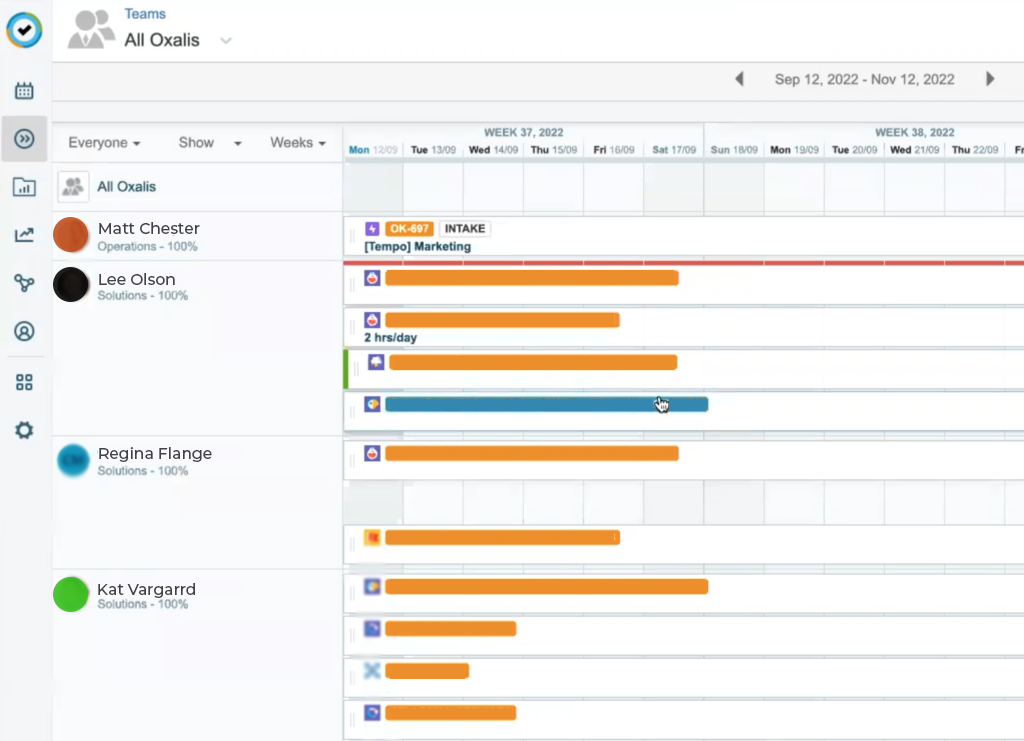
Then there’s the Timeline view, which displays the project each resource has hours planned for, across the chosen time period.
Planned vs. Actual
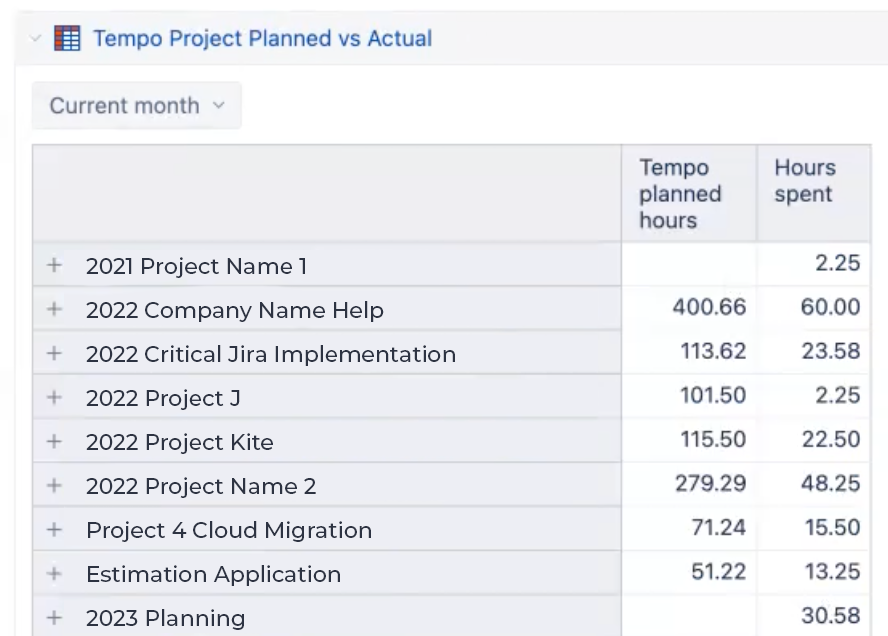
Now what happens? People will work, and they’ll log their hours to these specific projects, and the actual data will diverge from the plan. Tempo’s Planned vs Actual report will give you a sense for how closely teams and projects are working to their planned hours.
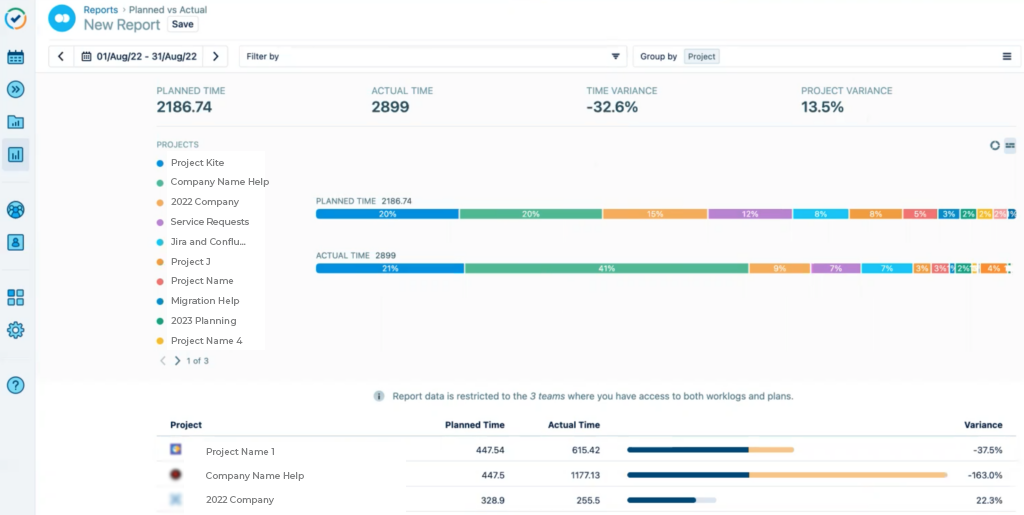
We have three sections (above):
You can filter and group to get more specific. This sort of pipeline overview has value, and is easy to get since it’s built into Tempo Planner. But it’s generic, and may or may not help you identify and track the specific issues you need to. And there are better ways to look at this data.
What EazyBI Adds
When you import the source data from Jira and Tempo into EazyBI, you open up a range of options for visually displaying the state of your capacity plans. Let’s look at some examples of what EazyBI can do for you; note that all these reports require custom setup, so you’ll need to allow sufficient time for that.
Here we see a Planned Utilization view that displays each resource’s planned hours compared to their capacity, to show who has more work planned than they can probably do in that time period, and who has time available to be planned.
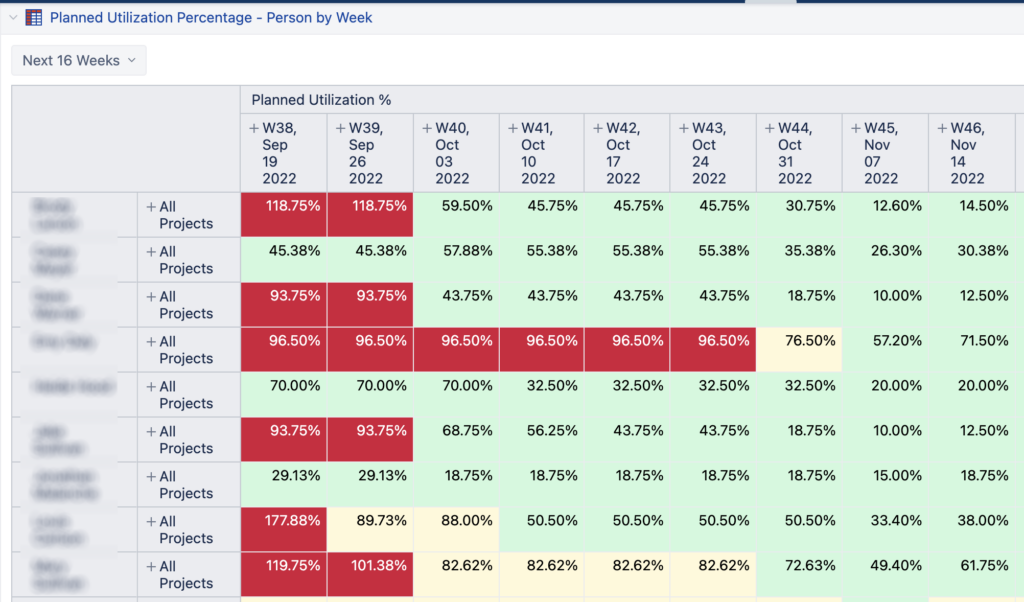
Green cells indicate plenty of available capacity, while yellow warns that the resource is close to capacity, and of course red means they’re over-allocated. This makes it easier to move work around and keep everyone allocated properly.
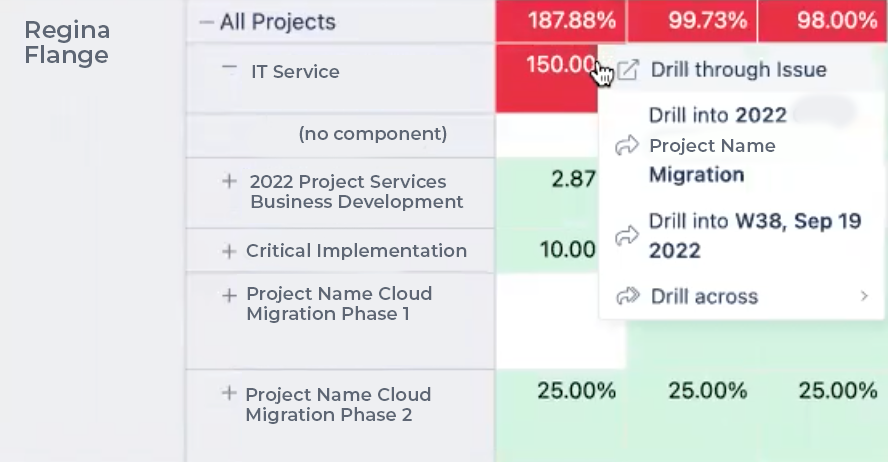
You can expand All Projects to see how the allocation breaks down by project and identify the source(s) of that over-allocation. Take that top left 118.75%, for example.
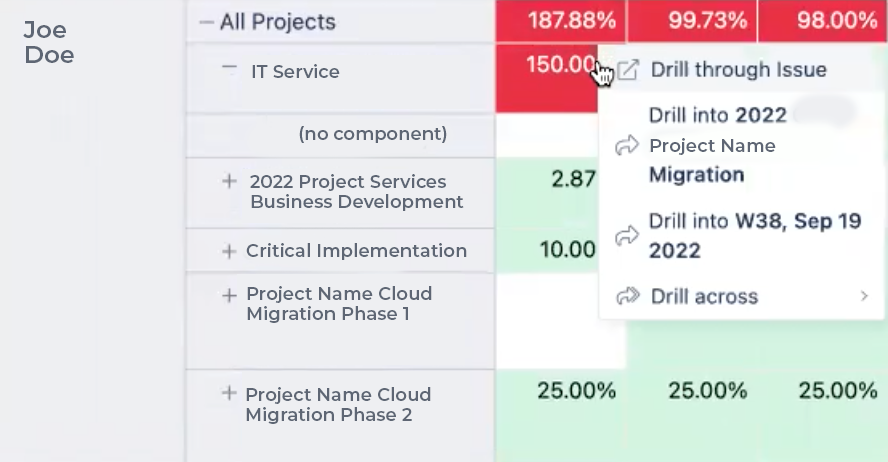
Now we see where that over-allocation comes from – the resource isn’t over-allocated for any one project, but just has too much time planned for too many projects. If the work is planned by component, you can expand a project and see that allocation as well. And right-clicking on a cell gives you several options for drilling further into those planned hours.
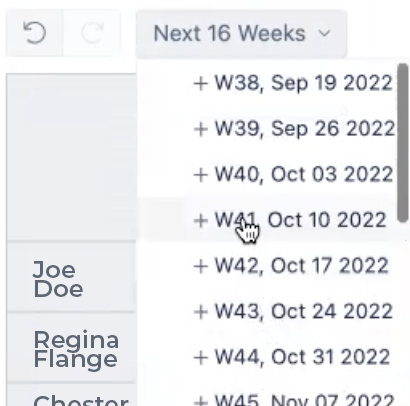
Using the timeline dropdown, you can change the period you’re reviewing, by week, by quarter, by year, and so on.
Now let’s look at what we can do for planned time versus actual time (PvA). Here is a dashboard that provides several options for getting an overview.
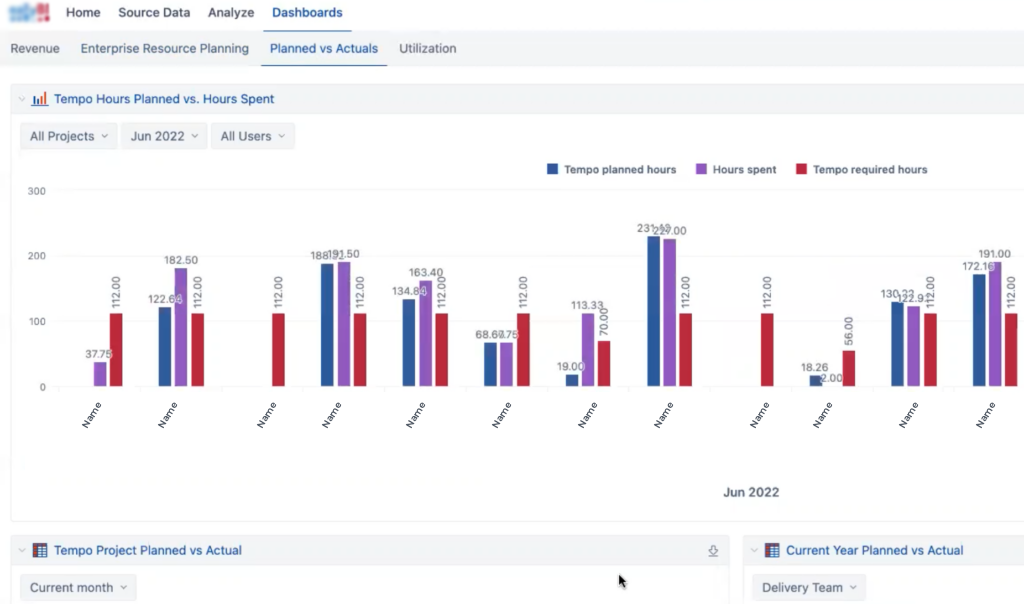
At the top is this resource graph showing each resource’s planned hours for the time period, actual hours spent, and hours required (e.g. 5×8 hours per week, or 3×10, or whatever you configure in Tempo). This makes the variance between planned, actual, and required easy to see.
Below are two reports, one showing PvA per project, and one showing PvA per month with % Utilization.
Each report lets you change a parameter, either the time period or the team. These numbers assume they’re required to work 40 hour weeks.
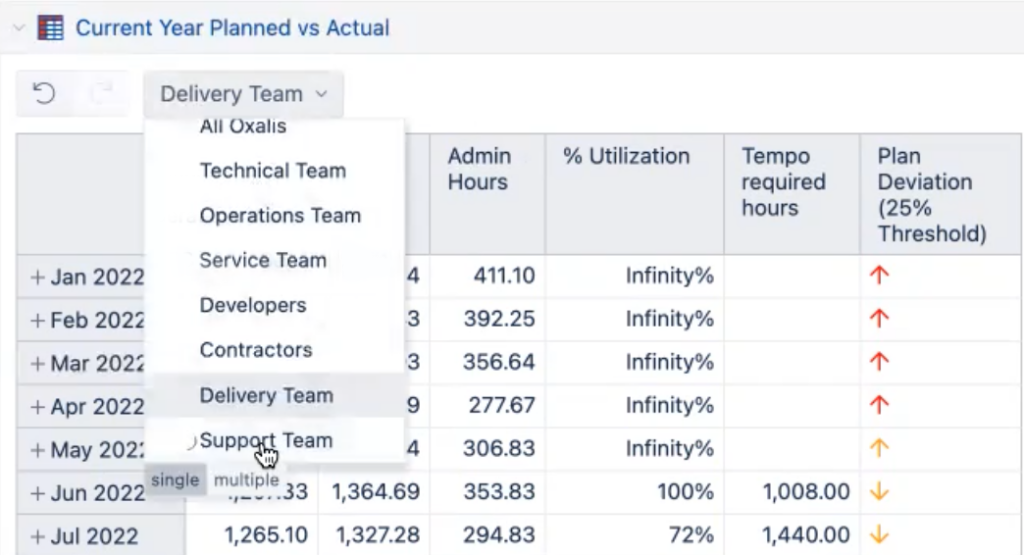
A closer look at the key idea behind % Utilization
All hours worked are not equal, and whenever you’re looking at all of a resource’s time (rather than by project), you might well be including admin or non-billable time. And that will throw off your numbers. So if your workers are logging their admin time, then you want to make sure you’re comparing planned hours to time actually spent on projects. Therefore, this % Utilization is Hours Spent minus Admin Hours divided by the Tempo planned hours.
At this macro level, PvA reports like this show you how efficiently teams, departments, or other resource pools are operating.
But EazyBI will also give us better insight into the resource level.

Here we can see, for each project, the weekly planned and actual hours for each assigned resource – along with a visual indicator of how well PvA is adhering to the plan. Or you can collapse the Users and see the totals by project. And the timeline can be per day instead, or by month, quarter, etc., while the Project dropdown lets you narrow the report.
These sorts of advanced capacity and utilization metrics – and more – are possible once you’re capturing the right data and displaying it the way you need.
You can:
Setting it up
All this operational goodness is only possible if you’ve set yourself up for success. The following processes are prerequisites.
Reviewing your plan: The value in PvA reporting starts with planning. You need to make sure that all relevant personnel are time planning sufficiently in advance to be useful, and adjust the plans as the situation on the ground changes.
Entering time worked: If work time isn’t logged accurately and on time, then you’re wasting your planning. And accuracy is tied to timeliness since most people’s recollection of what exactly they did a week ago won’t be so good. Ideally, you can cultivate a culture of daily time logging, whether it’s logging time in individual tasks, entering it in a central timesheet, or whatever your timekeeping process is. The good news is that the reporting applications we’ve discussed can also show you when people aren’t logging time, which gives you a way to reinforce the practice.
Being realistic about admin time: Any number of different things can take up an employee’s time, from meetings to emails to chats to phone calls to smoke breaks to bathroom breaks to clean the break room, and on and on. You can’t accurately assess an individual’s capacity unless you know how much time they actually have to work on the projects you’re planning. And this will vary by person! It’s worth putting in the effort to figure this out upfront, whether you use Atlassian’s Capacity Planning exercise or another approach. Without this key piece, you can do everything else here exactly right and still end up with PvA numbers that are frequently off.
Holding regular capacity planning meetings: Capacity planning can be done monthly, quarterly, weekly, or bimonthly – whatever works for you. No matter the cadence you choose, stick to it. Plan around those meetings. The more regularly you do it, the more you’ll get a feel for the process, for what it’s like to plan for that period. Shuffle resources around, address delivery scheduling risks, make performance staff decisions… and do it all with confidence because the data is now there to justify the decisions.
Team-based Resource Planning and Capacity
This approach is suitable for an organization that has reached a certain size. For instance, if you are trying to manage your capacity by only looking at individual resources, you’ll soon find that tactic becomes increasingly ineffective. You’ll have larger projects, larger teams, more levels, and types of teams. So how do you manage this efficiently?
Team-based capacity planning across multiple projects is supported in Jira Cloud Premium out-of-the-box version and up via Advanced Roadmaps (AR). Resource and capacity planning needs arise in earnest when you’re managing capacity across multiple projects, so you’ll want the Premium version. We have a full guide on how AR is set up to be operational. You can define teams that are dedicated to a plan – or the teams can be shared across multiple plans so that their capacity can be allocated in different parts of your portfolio according to your particular needs.
What AR offers for team-based capacity planning
This overview assumes familiarity with Advanced Roadmaps; to learn more about AR take a look at Advanced Roadmaps for Jira: Overview & Comparison or our ON-DEMAND webinar. Be sure to keep in mind that using the word “team” from this point on will mean a team as defined in AR terms, which may or may not match your organizational structure. More on that later.
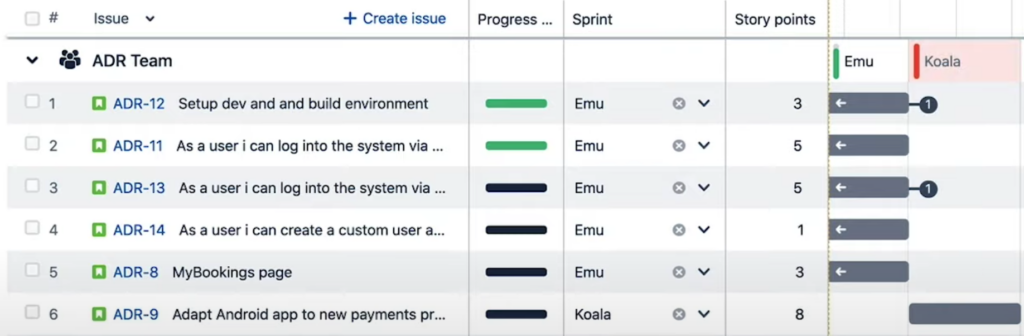
Team-based planning is easy to access in an AR plan – just choose Team in the ‘Group by’ setting and turn on ‘Show capacity on timeline’. Using AR for planning is an entire topic of its own, so we’ll assume here that you know how and have both created some plans and defined some teams.
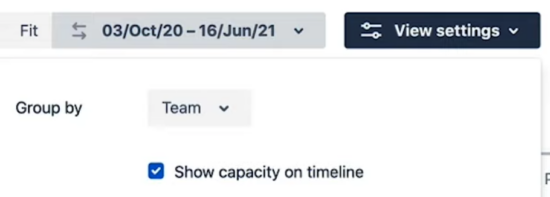
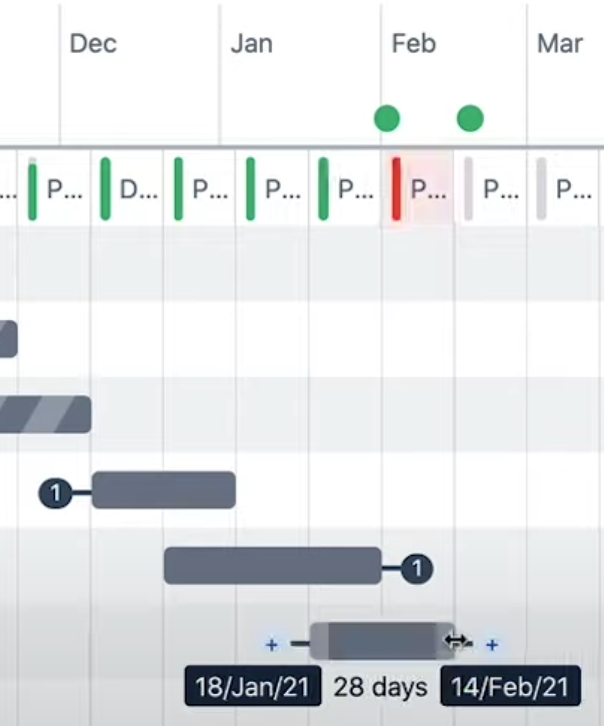
This will add a capacity indicator row for each team, using the planned dates from your sprints and the total story points for each sprint. This capacity indicator works no matter what level(s) of issue you’re viewing, from Epic to Sub-task.

The green lines in each cell indicate that the time period is at or under capacity – in fact, the height of the green line shows you how close to capacity that period is. And of course, red lines indicate that the work included in that time period exceeds the team’s capacity. You may need to reduce the timeline displayed in order to see more detail; this can be done in the lower right.

But what exactly does capacity mean here?
Capacity Overview
Generally speaking, the number of story points or hours your team can complete in one iteration is referred to as its capacity. But capacity works differently for Scrum vs. Kanban teams. Let’s define these two types of teams further.
Capacity for Scrum teams
When scheduling work for Scrum teams, capacity is calculated differently for time-based estimates and story points:
If you’re using time-based estimates, the sprint capacity is determined by taking the weekly capacity and multiplying by the number of weeks per iteration. For example, if your team’s capacity is 40 hours and your iterations last two weeks, your team’s sprint capacity will be 80 hours.
If you estimate in story points, no conversion is necessary since story points are defined per iteration. The capacity applies to the whole sprint. By default, this is set to 30 story points, though you can adjust this to meet your team’s needs.
Capacity for Kanban teams
Kanban teams can only use time-based estimates, so be sure to populate the Original Estimate and Remaining Work fields.
For Kanban teams, work is broken down into iterations which each last one week (this cannot be altered). You can set the weekly capacity of a Kanban team in either days or hours, but the length of the iteration cannot be changed. If you set the weekly capacity in hours, here’s an example of how AR converts that into days: a weekly team capacity of 30 hours is 3/4 of the full 40 hour work week, and 3/4 of a 5-day work week is 3.75 days, and if the team has 6 team members, the weekly capacity in days is 3.75 X 6 = 22.5.
Assessing Your Capacity
You can view a popup summary of each period (sprint or iteration) in the chart by clicking on it. Here’s what that might look like for Kanban – note that you can change the capacity of that period by clicking on the capacity number, e.g, the 25 in both these examples
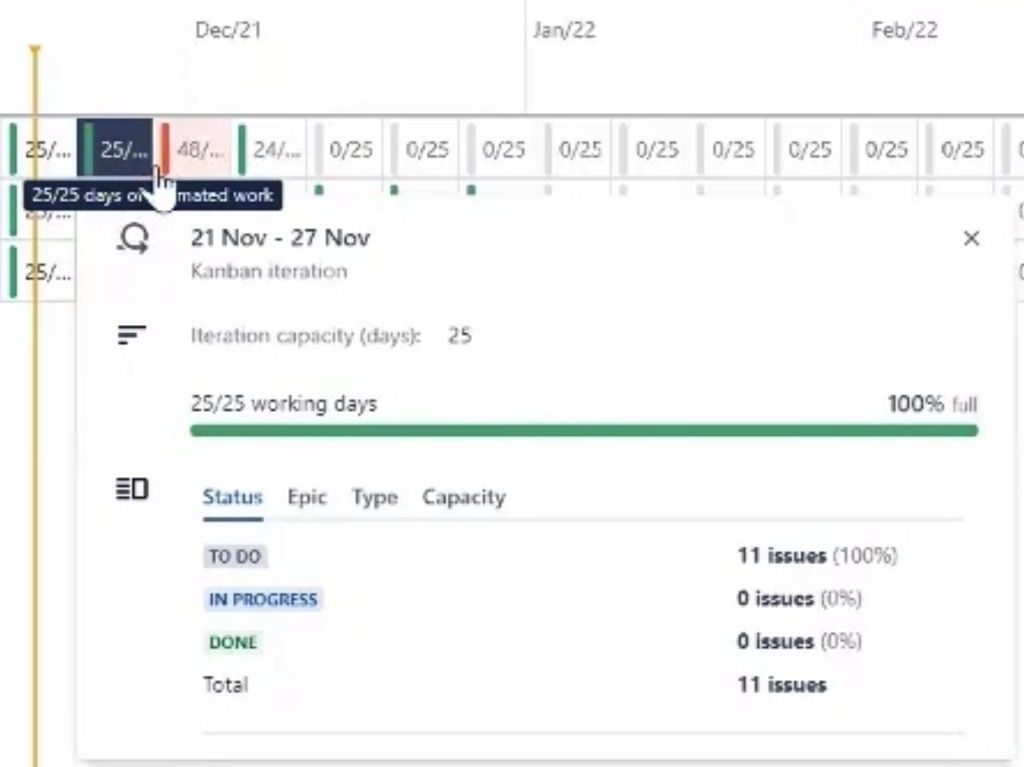
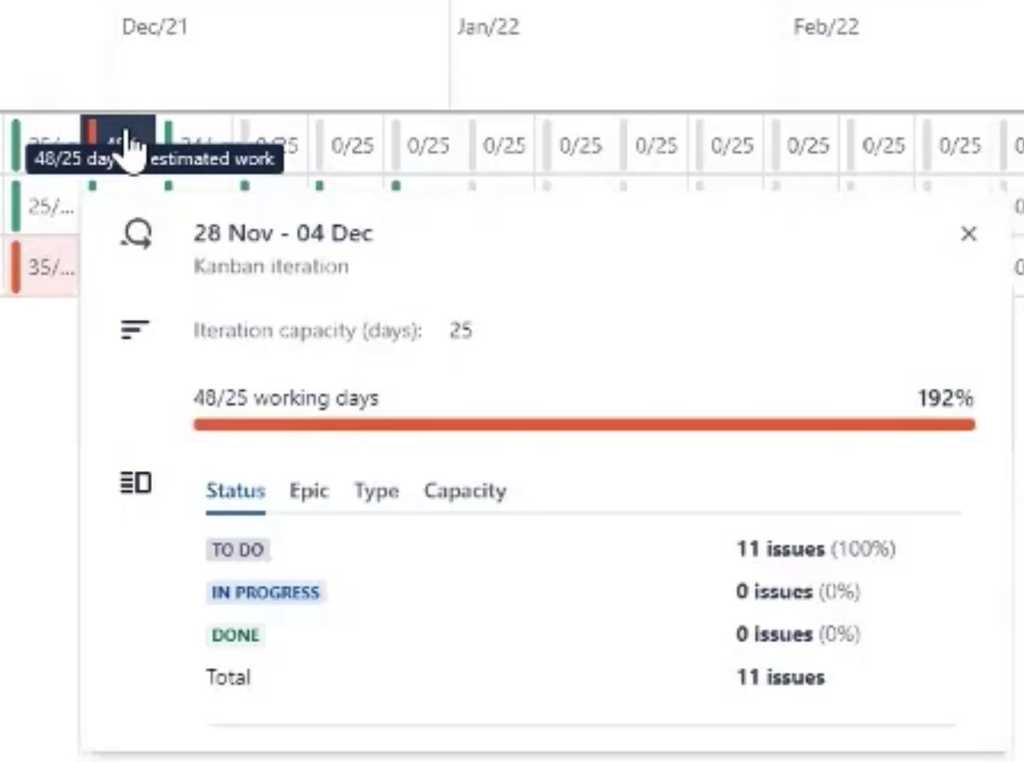
Let’s take a closer look at this important feature.
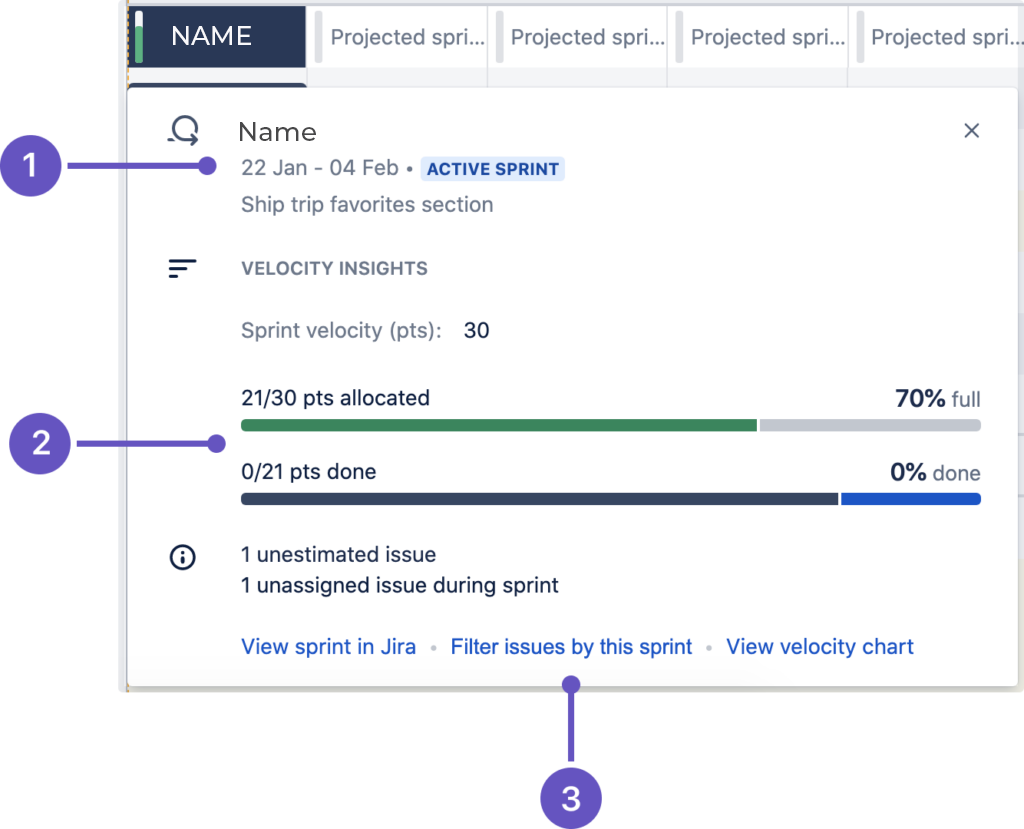
- Sprint information – Name, start and end dates, status lozenge, sprint goal (as defined by administrator), and total sprint capacity
- Progress bar – Story points allotted and completed
- Further viewing options for this sprint
For over-allocated time periods, if you expand to show the issues and add the Original Estimate field, or Sprint and Story Points fields, you can easily use AR’s regular planning functions to move issues around, adjust work estimates, start and due dates, etc.
How Capacity Decrements
When an issue is added to an iteration, it will consume the estimated value (story points or days/hours) from the capacity value set by your administrator. Issues that span multiple iterations will consume all remaining capacity of the first iteration before moving on to the next one. Capacity is assigned on a first-come, first served basis – meaning that pre-existing issues won’t be moved. This is true whether you’re using story points or time-based estimates.
Assigned issues that consume more capacity than is available in an iteration will generate a warning (if those are turned on). We recommend that any assigned issues that have an estimation value higher than the capacity be broken down into smaller subtasks or spread across multiple iterations.
Note that issues with start and end dates that fall within a sprint will consume capacity, even though they’re not assigned to that sprint. When monitoring capacity, these issues are marked with the label x issues not assigned to a sprint.
What This All Gets You
Now you can accomplish several capacity-related tasks:
The visual capacity warnings are updated live as you click and drag to add scheduling – even at the Epic level.
Generally, most enterprises and other sizable organizations need to understand where they’re deficient in one particular skill set or resource.
But wherever the capacity is that you want to manage, structure your teams to ensure that capacity can be measured.
The team-based model is a more scalable model, which is increasingly important the larger your organization is, and helps you with larger-scale challenges like staffing. If, however, you have unique resources, skillsets that don’t exist as a pool, then team-based capacity planning can break down – you need interchangeable resources at all levels and skills. The ideal scenario for team-based capacity planning is tracking what teams can actually execute on, and calibrating their availability based on their past performance.
The truth is, even with effective team-based planning in place, most organizations – even enterprise or large departments – will still want some level of individual capacity planning, to know what’s happening with specific critical resources for their projects and if those resources are being over-allocated or under-allocated.
Setting it up
There are several key configurations for effective team-based resource capacity planning in AR.
Setting up the right teams: You can use AR’s Teams to reproduce your Scrum or Kanban teams, or you can group people into skill sets, resource types, etc. Just think it through, because whatever you can’t manage the capacity of something you don’t configure here.
This is important even if your teams are cross-functional, like sprint teams of various types of resources, in which case your AR teams won’t match your teams in reality.
Choosing the right issue sources: Your plan must be configured to use the relevant team boards as the issue sources, so that the plan has access to the sprint information, like velocity.
Matching the team to the board: Each team in your plan must be configured to use the appropriate board as the associated issue source. If you create your plan using the team boards, this will happen automatically, otherwise you have to do it yourself.
Setting the team’s velocity (Scrum): If you’re doing sprints, each team’s sprint velocity must be set, since that is AR’s measure of actual work achieved; make sure it’s based on historical data, and not on guessing or wishful thinking.
Populating Story Points (Scrum): If you’re doing sprints, your teams must be strict about setting Story Points, since that tells AR how close to capacity each sprint is. Without this, you risk over-allocating sprints and not getting it all done.
Populating Original Estimate (Kanban): This serves the same purpose for Kanban as Story Points do for Scrum.
Keeping Work Remaining Accurate (Kanban): If AR thinks there’s more work left to do than there really is, then your resource capacity planning will be off. So everyone has to be diligent about updating the Work Remaining field.
Results and Benefit to the Organization
We’ve identified seven benefits your enterprise will experience when you are engaged in effective resource capacity planning. You will:
Recommended blog posts
In this data-driven world, capacity planning data opens the door to a new level of operational success.
Get started with the tools your team actually wants to use
Inevitably, enterprise-level tools like Tempo Planner, EazyBI, and Jira’s Advanced Roadmaps have more to offer on resource capacity planning than any one article can reasonably cover.
We get it. Your organization has unique workflows that constitutes smart solutions, freeing up valuable time for your teams to operate more efficiently is more important now than ever. The team at Oxalis is here to help you transform processes within your organization – get started today.