A Guide to Effective Resource Capacity Planning in Jira

This article covers how to be more effective at individual and team planning, and how to streamline your project workflows across departments. We’ll discover two approaches to resource capacity planning, and outline the strategies, benefits, and best practices for each. Everything discussed here can be scaled, helping your enterprise function at premiere performance. See how applying effective resource capacity planning can ensure seven instantaneous benefits your business can utilize to function at peak performance.

Table of contents

The Challenge of Effective Resource Capacity Planning

Identify what you really need to know

On a basic level, capacity planning is an obvious need. You don’t want employees tasked with so much work that some of it goes unfinished, and you don’t want employees with too much idle time – especially if others are overworked. How do you find a balance? Companies are looking for solutions to help streamline this flux of workflow. Resolving capacity problems and implementing effective solutions will help your business deliver projects on time and continue to conduct business without workflow interruptions.

Because your organization is unique, you need to be clear on what level of resource capacity planning you’re already doing, and what you aren’t. Let’s look at the following scenarios to help clarify this a bit further.

  • Maybe team managers have been handling individual resource capacity, but now your organization is growing and you need a larger view across projects.
  • Are you more concerned about allocating skills, or work roles/positions?
  • Is there a particular problem or set of problems you want to solve?
  • Or are you trying to get out ahead of potential problems?

Even in the latter case, you still need to identify which problems you’re most concerned about. Consider whether it would be more useful to group your employees by team, department, role, key skillset, etc. That grouping will affect a lot of the reporting options we’ll be looking at. If you skip this step, it’ll be hard to choose the right tools or know-how to make effective use of the data they give you.

Determine which tool(s) to use

There are, obviously, plenty of tools that either include resource capacity planning as a feature or focus on it exclusively.
Two key aspects to consider when selecting a tool are:

  • Whether the data it gathers will help you with the problems you want to solve
  • How flexible the tool can display that data in different ways. It may be that the tool’s built-in reporting will meet your needs, or you may need an additional tool to give you more options. We’ll discuss some particular tools later on.

Capture the right data

There are several capacity-related elements you may want to report on, such as the team an individual belongs to, and what projects they’re working on. You don’t want to choose a tool that ignores teams if you want to see a capacity for your team. 

Present the data so it tells you what you need to know

Capacity planning is about data – the number of hours employees are allocated to various projects and the hours they worked on those projects. That data can, with the right tools, be displayed in a wide variety of ways. Each of those displays tells a different story, and you want to make sure you hear the stories you need to hear.


Two Approaches to Resource Capacity Planning

The two fundamental approaches to capacity planning are team-based and individual-based. Most organizations will need a combination of the two, but it’s important to understand them separately. We’ll run through how each works using Jira and our favorite tools.

Individual-based Planning and Capacity

This approach probably doesn’t need much explanation, since even a small organization will find it useful to plan each employee’s workload. In order to support individual-based capacity planning with Jira, you’ll need some Atlassian Marketplace addons. Here we’ll cover using Tempo (with Tempo Planner and Tempo Timesheets) plus EazyBI to display the data as we need it.

What You Get with Tempo

Planning

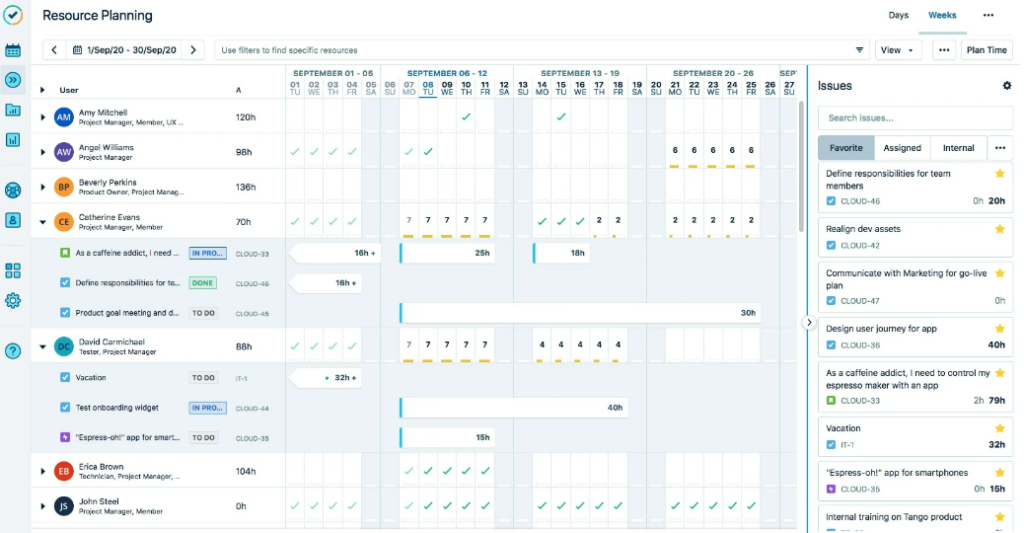
Tempo Planner gives you a number of options for viewing planning data.
Tempo The planned hours view in Tempo planner
The planned hours view in Tempo Planner

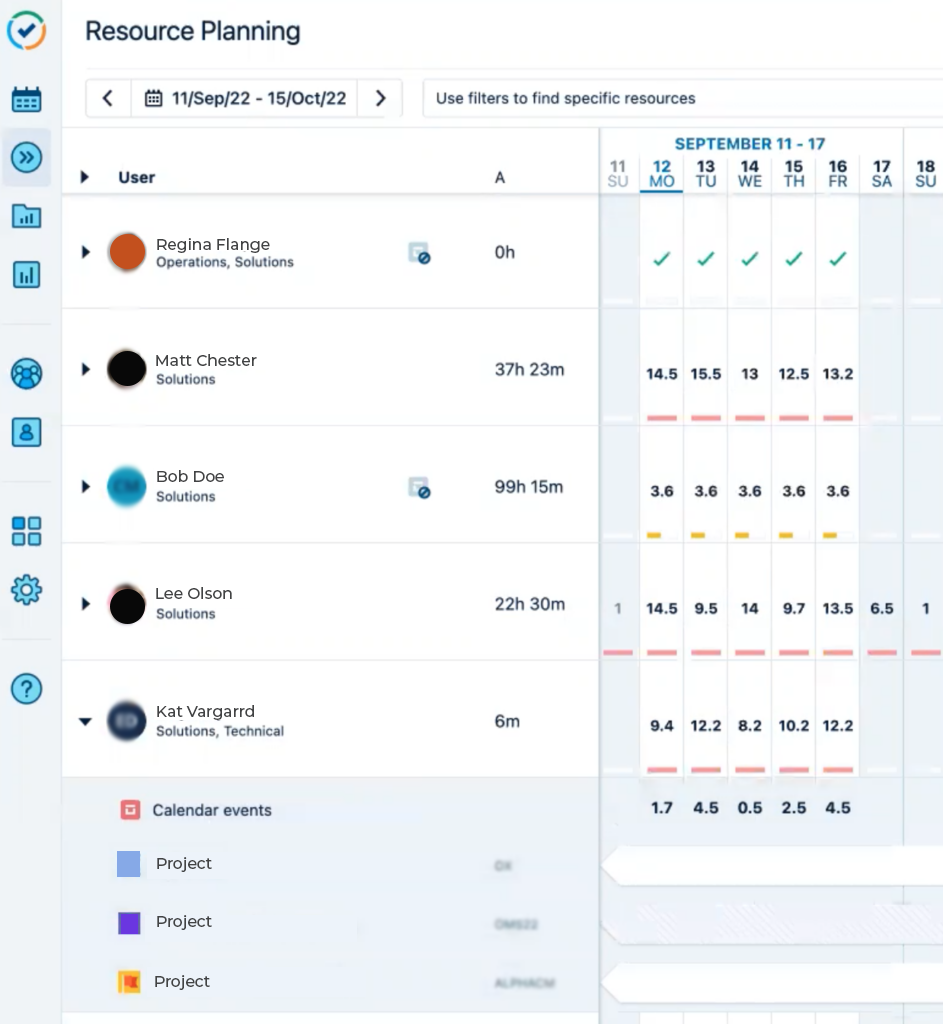
Here we see the Resource Planning view.

Each row is a resource, labeled with the Tempo team(s) they belong to, and a column for each day. A red bar in a table cell indicates that the resource has more hours planned for that day than they have capacity, while yellow means they have spare capacity. By default, the allocated hours for each resource are summed across all projects, but you can expand a resource to see their allocation by project. And this is more than a report – you can add planned hours right in the screen.

It’s easy to change the displayed time period, and you can use filters to show only certain resources.

Then there’s the Timeline view, which displays the project each resource has hours planned for, across the chosen time period.
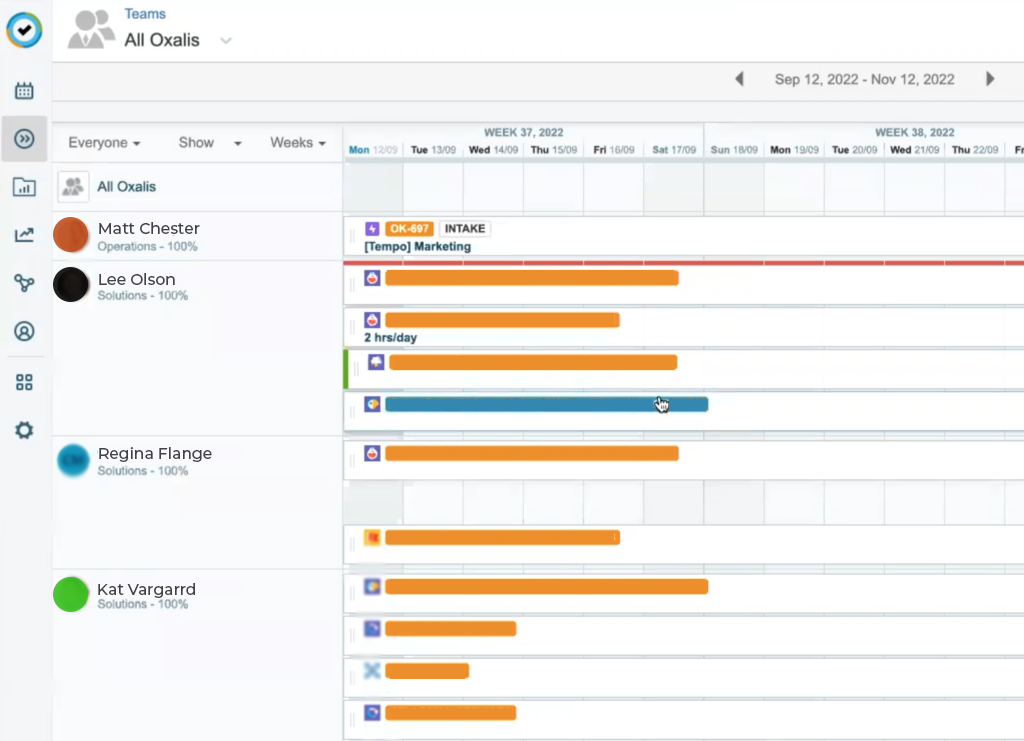
Tempo Resource planning in tempo by project
Resource planning in Tempo by project
Planned vs. Actual

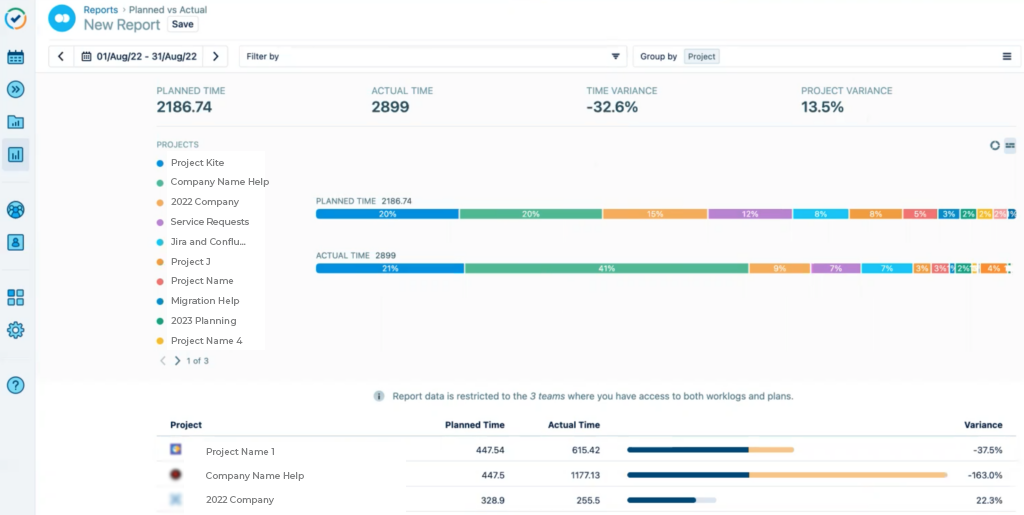
Now what happens? People will work, and they’ll log their hours to these specific projects, and the actual data will diverge from the plan. Tempo’s Planned vs Actual report will give you a sense for how closely teams and projects are working to their planned hours.
Tempo The default overview in Tempo's Planned vs Actual report
The default overview in Tempo’s Planned vs Actual report

We have three sections (above):

  • at the top, total hours across all resources and projects
  • in the middle, a visual breakdown of planned and actual time by project
  • and at the bottom, a list by project.

You can filter and group to get more specific. This sort of pipeline overview has value, and is easy to get since it’s built into Tempo Planner. But it’s generic, and may or may not help you identify and track the specific issues you need to. And there are better ways to look at this data.

What EazyBI Adds

When you import the source data from Jira and Tempo into EazyBI, you open up a range of options for visually displaying the state of your capacity plans. Let’s look at some examples of what EazyBI can do for you; note that all these reports require custom setup, so you’ll need to allow sufficient time for that.

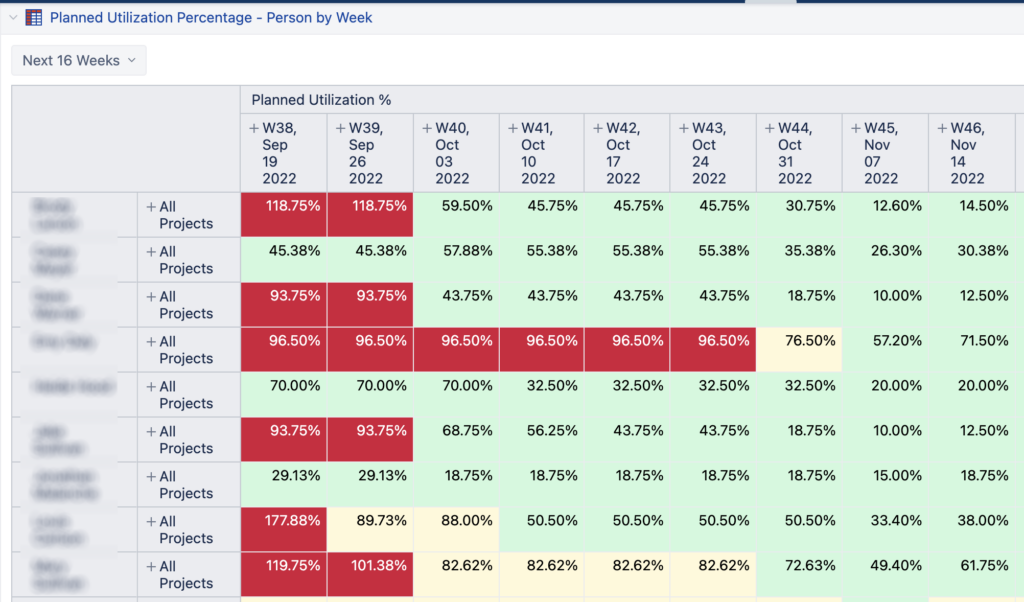
Here we see a Planned Utilization view that displays each resource’s planned hours compared to their capacity, to show who has more work planned than they can probably do in that time period, and who has time available to be planned.
Sample EazyBI report: Planned Utilization Percentage tempo
Sample EazyBI report: Planned Utilization Percentage

Green cells indicate plenty of available capacity, while yellow warns that the resource is close to capacity, and of course red means they’re over-allocated. This makes it easier to move work around and keep everyone allocated properly.

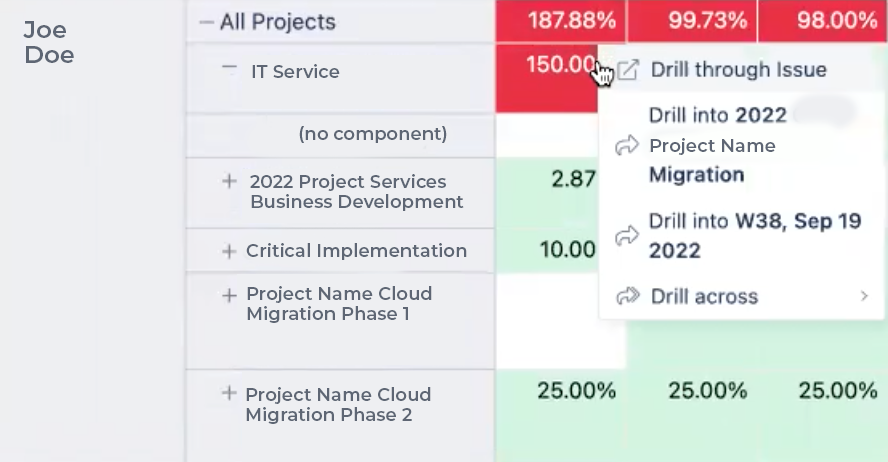
You can expand All Projects to see how the allocation breaks down by project and identify the source(s) of that over-allocation. Take that top left 118.75%, for example.
The Planned Utilization Percentage report with per-project breakdown tempo
The Planned Utilization Percentage report with per-project breakdown

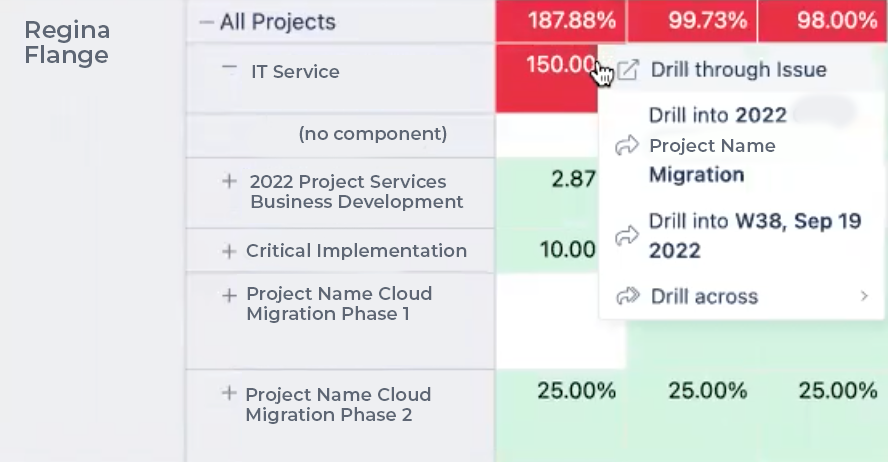
Now we see where that over-allocation comes from – the resource isn’t over-allocated for any one project, but just has too much time planned for too many projects. If the work is planned by component, you can expand a project and see that allocation as well. And right-clicking on a cell gives you several options for drilling further into those planned hours.
More right-click options for EazyBI reports tempo
More right-click options for EazyBI reports

Using the timeline dropdown, you can change the period you’re reviewing, by week, by quarter, by year, and so on.
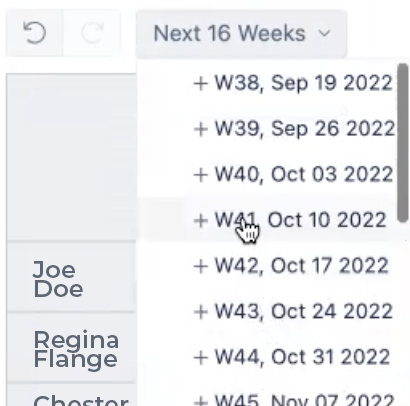
Tempo timeline dropdown tempo

Now let’s look at what we can do for planned time versus actual time (PvA). Here is a dashboard that provides several options for getting an overview.
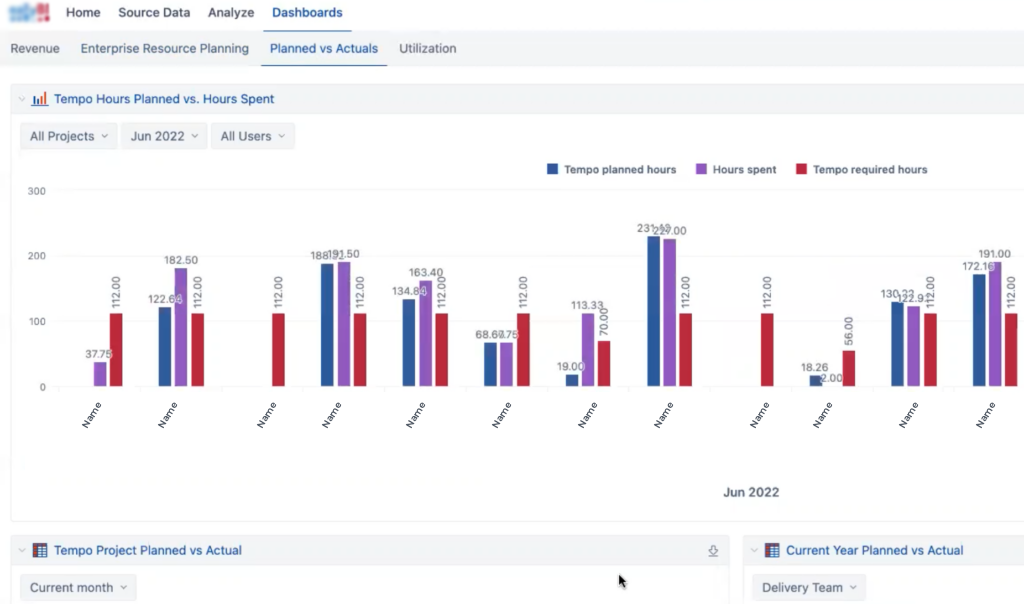
Tempo Sample EazyBI dashboard - Planned vs Actuals
Sample EazyBI dashboard – Planned vs Actuals

At the top is this resource graph showing each resource’s planned hours for the time period, actual hours spent, and hours required (e.g. 5×8 hours per week, or 3×10, or whatever you configure in Tempo). This makes the variance between planned, actual, and required easy to see.

Below are two reports, one showing PvA per project, and one showing PvA per month with % Utilization.
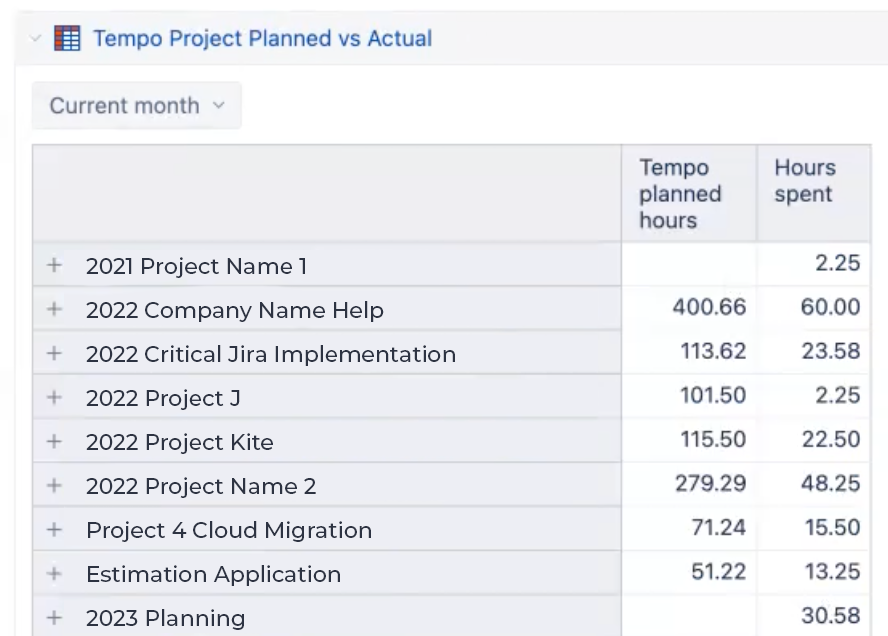
Tempo Sample report in dashboard - Planned vs Actuals by project
Sample report in dashboard – Planned vs Actuals by project

Each report lets you change a parameter, either the time period or the team. These numbers assume they’re required to work 40 hour weeks.
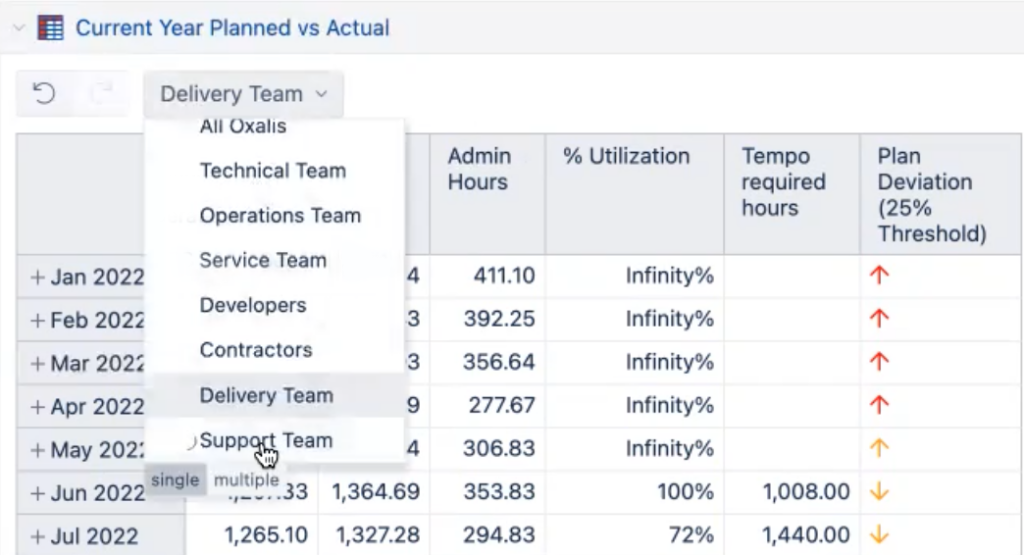
Sample report in dashboard - Planned vs Actuals by team
Sample report in dashboard – Planned vs Actuals by team

A closer look at the key idea behind % Utilization

All hours worked are not equal, and whenever you’re looking at all of a resource’s time (rather than by project), you might well be including admin or non-billable time. And that will throw off your numbers. So if your workers are logging their admin time, then you want to make sure you’re comparing planned hours to time actually spent on projects. Therefore, this % Utilization is Hours Spent minus Admin Hours divided by the Tempo planned hours.

At this macro level, PvA reports like this show you how efficiently teams, departments, or other resource pools are operating.

But EazyBI will also give us better insight into the resource level.
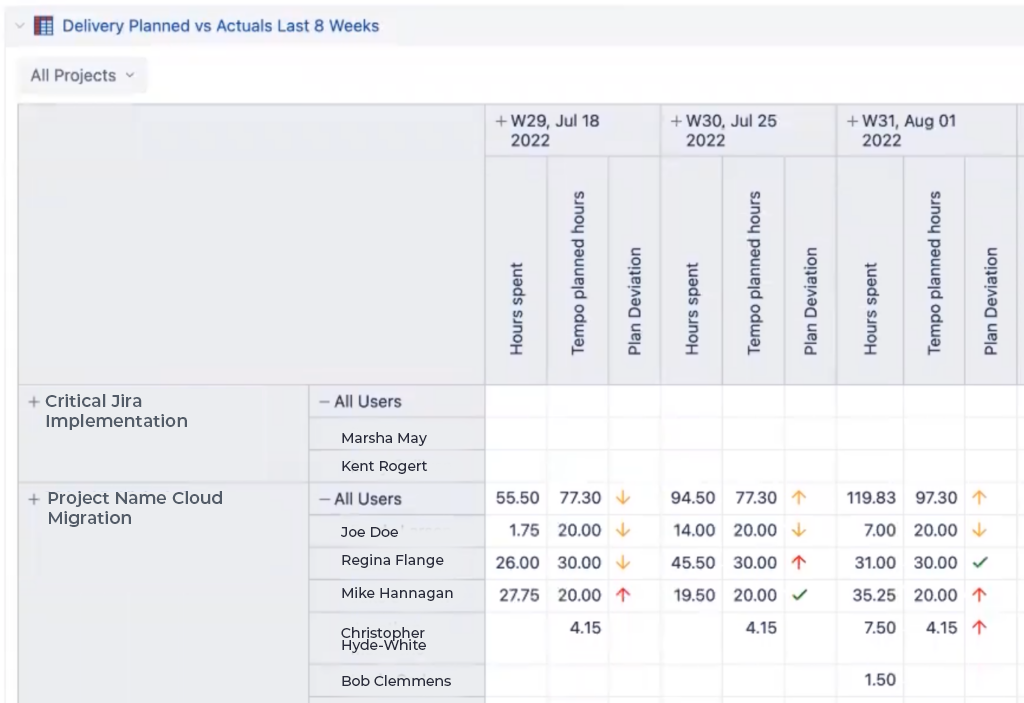
Tempo Sample report in dashboard - Planned vs Actuals by project and resource
Sample report in dashboard – Planned vs Actuals by project and resource

Here we can see, for each project, the weekly planned and actual hours for each assigned resource – along with a visual indicator of how well PvA is adhering to the plan. Or you can collapse the Users and see the totals by project. And the timeline can be per day instead, or by month, quarter, etc., while the Project dropdown lets you narrow the report.

These sorts of advanced capacity and utilization metrics – and more – are possible once you’re capturing the right data and displaying it the way you need.

You can:

  • Identify departmental bottlenecks and other challenges.
  • Ensure that all resources are properly utilized.
  • Keep projects on schedule AND quickly slot new projects into timelines based on when the resources are available.
  • Improve hiring cadence by planning intake so new hires are in place and ready by the time they’re actually needed.
  • Schedule project milestones, code releases, and other delivery events efficiently because you see the impact on the teams involved.
  • And so on.

Setting it up

All this operational goodness is only possible if you’ve set yourself up for success. The following processes are prerequisites.

Reviewing your plan: The value in PvA reporting starts with planning. You need to make sure that all relevant personnel are time planning sufficiently in advance to be useful, and adjust the plans as the situation on the ground changes.

Entering time worked: If work time isn’t logged accurately and on time, then you’re wasting your planning. And accuracy is tied to timeliness since most people’s recollection of what exactly they did a week ago won’t be so good. Ideally, you can cultivate a culture of daily time logging, whether it’s logging time in individual tasks, entering it in a central timesheet, or whatever your timekeeping process is. The good news is that the reporting applications we’ve discussed can also show you when people aren’t logging time, which gives you a way to reinforce the practice.

Being realistic about admin time: Any number of different things can take up an employee’s time, from meetings to emails to chats to phone calls to smoke breaks to bathroom breaks to clean the break room, and on and on. You can’t accurately assess an individual’s capacity unless you know how much time they actually have to work on the projects you’re planning. And this will vary by person! It’s worth putting in the effort to figure this out upfront, whether you use Atlassian’s Capacity Planning exercise or another approach. Without this key piece, you can do everything else here exactly right and still end up with PvA numbers that are frequently off.

Holding regular capacity planning meetings: Capacity planning can be done monthly, quarterly, weekly, or bimonthly – whatever works for you. No matter the cadence you choose, stick to it. Plan around those meetings. The more regularly you do it, the more you’ll get a feel for the process, for what it’s like to plan for that period. Shuffle resources around, address delivery scheduling risks, make performance staff decisions… and do it all with confidence because the data is now there to justify the decisions.

Team-based Resource Planning and Capacity

This approach is suitable for an organization that has reached a certain size. For instance, if you are trying to manage your capacity by only looking at individual resources, you’ll soon find that tactic becomes increasingly ineffective. You’ll have larger projects, larger teams, more levels, and types of teams. So how do you manage this efficiently?

Team-based capacity planning across multiple projects is supported in Jira Cloud Premium out-of-the-box version and up via Advanced Roadmaps (AR). Resource and capacity planning needs arise in earnest when you’re managing capacity across multiple projects, so you’ll want the Premium version. We have a full guide on how AR is set up to be operational. You can define teams that are dedicated to a plan – or the teams can be shared across multiple plans so that their capacity can be allocated in different parts of your portfolio according to your particular needs.

What AR offers for team-based capacity planning

This overview assumes familiarity with Advanced Roadmaps; to learn more about AR take a look at Advanced Roadmaps for Jira: Overview & Comparison or our ON-DEMAND webinar.  Be sure to keep in mind that using the word “team” from this point on will mean a team as defined in AR terms, which may or may not match your organizational structure. More on that later.

Team-based planning is easy to access in an AR plan – just choose Team in the ‘Group by’ setting and turn on ‘Show capacity on timeline’. Using AR for planning is an entire topic of its own, so we’ll assume here that you know how and have both created some plans and defined some teams.
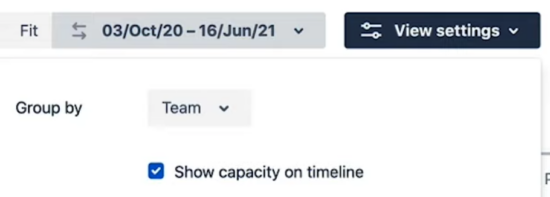
Team-based planning is easy to access in an advanced roadmaps plan

This will add a capacity indicator row for each team, using the planned dates from your sprints and the total story points for each sprint. This capacity indicator works no matter what level(s) of issue you’re viewing, from Epic to Sub-task.
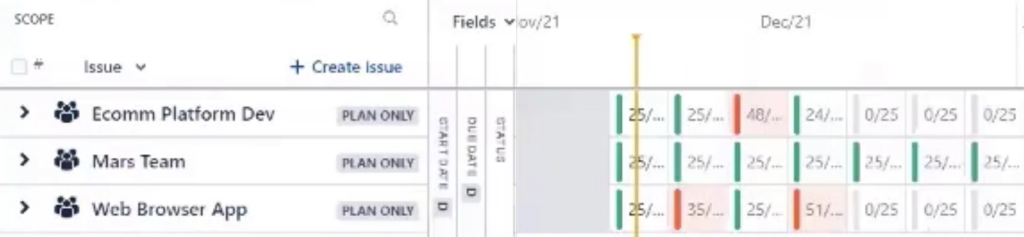
Epic to Sub-task chart

The green lines in each cell indicate that the time period is at or under capacity – in fact, the height of the green line shows you how close to capacity that period is. And of course, red lines indicate that the work included in that time period exceeds the team’s capacity. You may need to reduce the timeline displayed in order to see more detail; this can be done in the lower right.
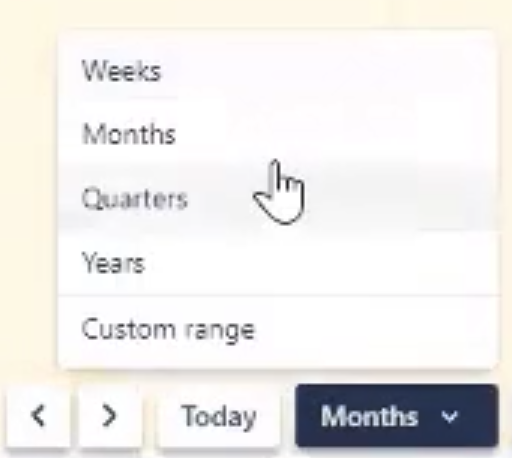
time period: Jira Advanced Roadmaps

But what exactly does capacity mean here?

Capacity Overview

Generally speaking, the number of story points or hours your team can complete in one iteration is referred to as its capacity. But capacity works differently for Scrum vs. Kanban teams. Let’s define these two types of teams further.

Capacity for Scrum teams

When scheduling work for Scrum teams, capacity is calculated differently for time-based estimates and story points:

If you’re using time-based estimates, the sprint capacity is determined by taking the weekly capacity and multiplying by the number of weeks per iteration. For example, if your team’s capacity is 40 hours and your iterations last two weeks, your team’s sprint capacity will be 80 hours.

If you estimate in story points, no conversion is necessary since story points are defined per iteration. The capacity applies to the whole sprint. By default, this is set to 30 story points, though you can adjust this to meet your team’s needs.

Capacity for Kanban teams

Kanban teams can only use time-based estimates, so be sure to populate the Original Estimate and Remaining Work fields.

For Kanban teams, work is broken down into iterations which each last one week (this cannot be altered). You can set the weekly capacity of a Kanban team in either days or hours, but the length of the iteration cannot be changed. If you set the weekly capacity in hours, here’s an example of how AR converts that into days: a weekly team capacity of 30 hours is 3/4 of the full 40 hour work week, and 3/4 of a 5-day work week is 3.75 days, and if the team has 6 team members, the weekly capacity in days is 3.75 X 6 = 22.5.

Assessing Your Capacity

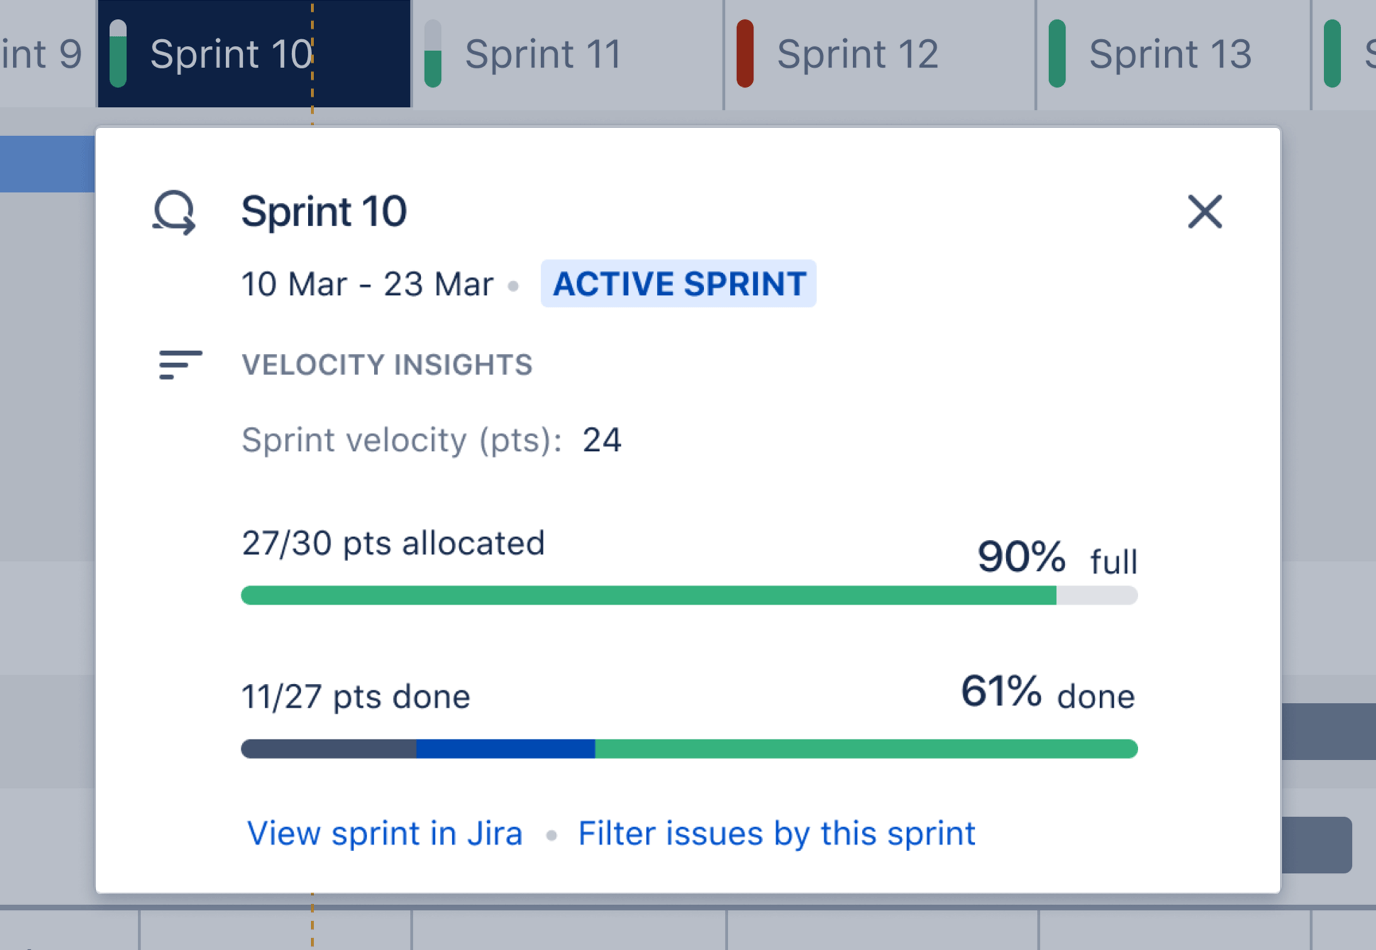
You can view a popup summary of each period (sprint or iteration) in the chart by clicking on it. Here’s what that might look like for Kanban – note that you can change the capacity of that period by clicking on the capacity number, e.g, the 25 in both these examples
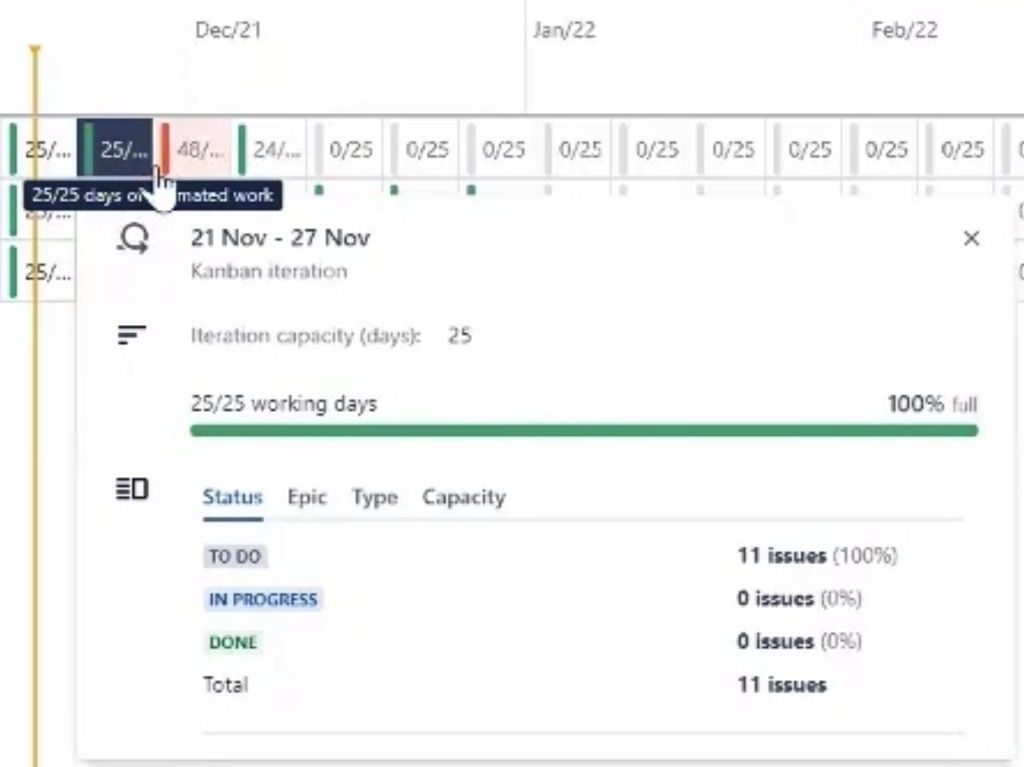
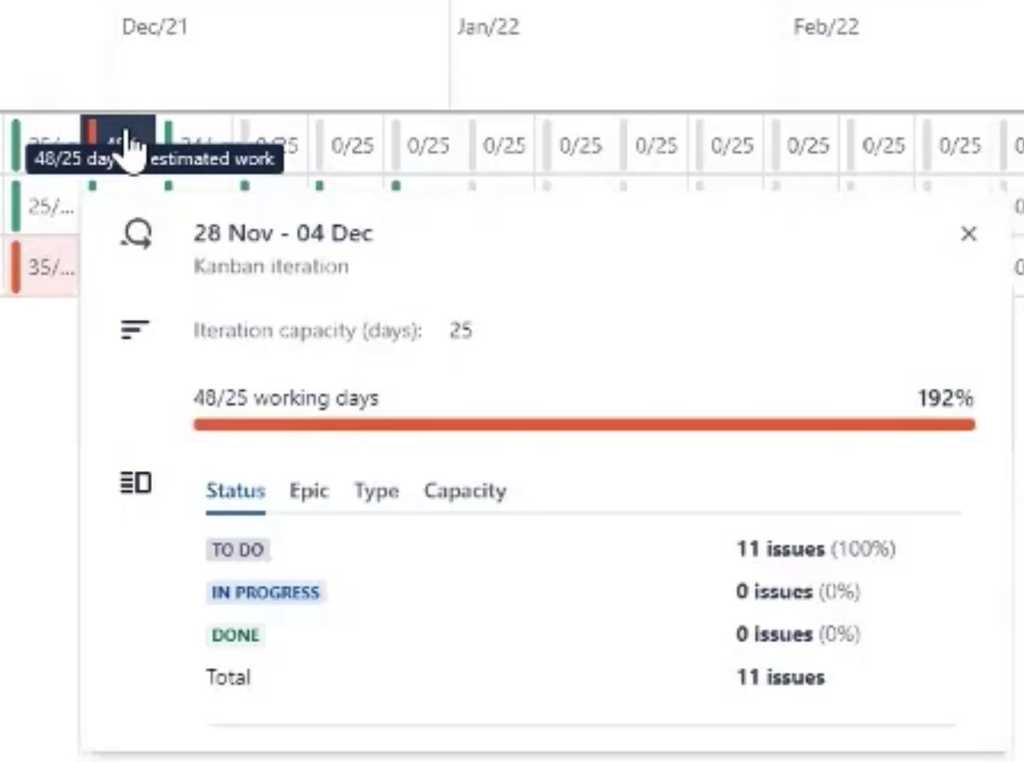
popup summary of each period kanban
kanban popup summary of each period

Let’s take a closer look at this important feature.
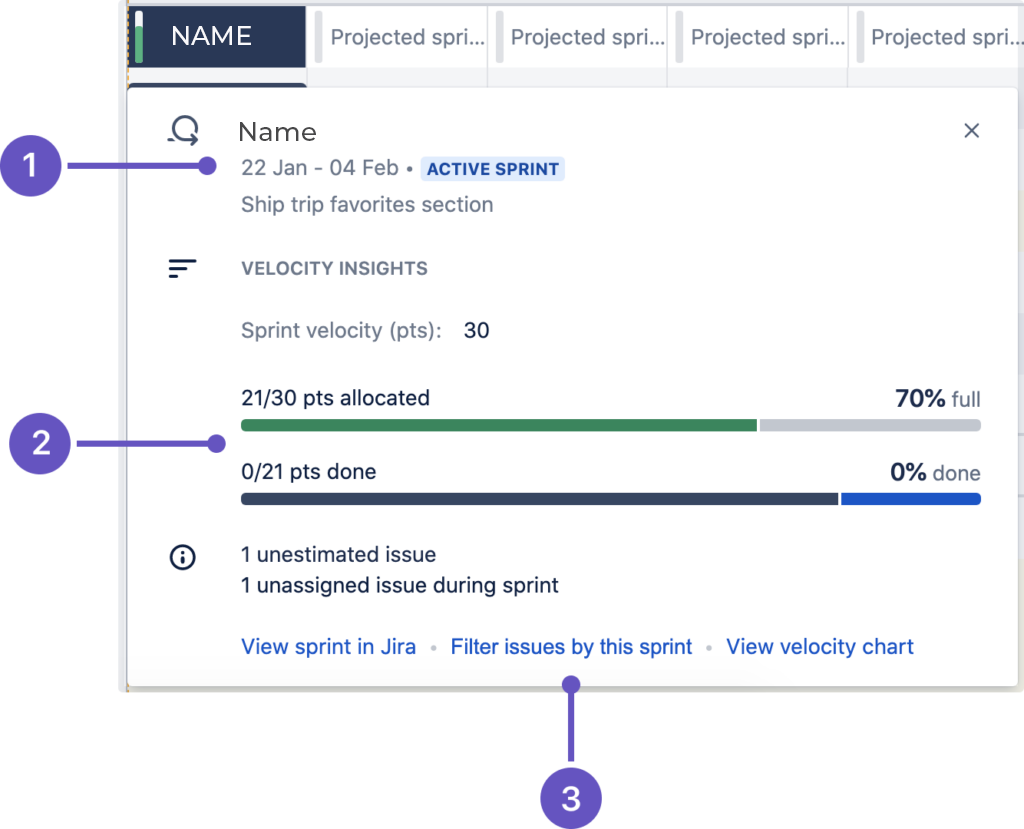
Sprint information
  1. Sprint information – Name, start and end dates, status lozenge, sprint goal (as defined by administrator), and total sprint capacity
  2. Progress bar – Story points allotted and completed
  3. Further viewing options for this sprint

For over-allocated time periods, if you expand to show the issues and add the Original Estimate field, or Sprint and Story Points fields, you can easily use AR’s regular planning functions to move issues around, adjust work estimates, start and due dates, etc.
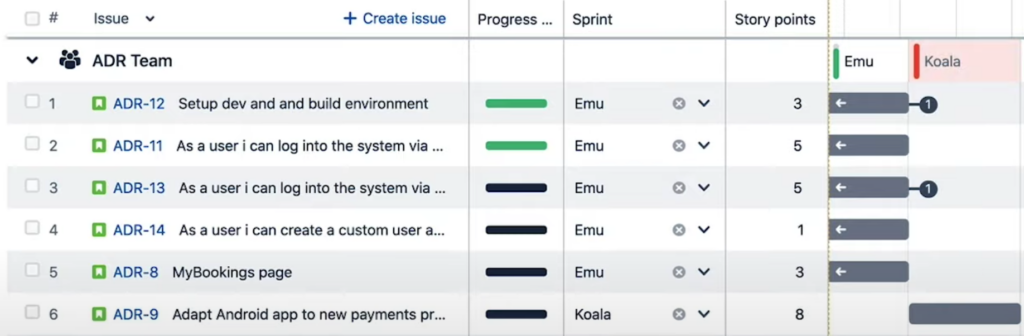
Original Estimate field, or Sprint and Story Points fields

How Capacity Decrements

When an issue is added to an iteration, it will consume the estimated value (story points or days/hours) from the capacity value set by your administrator. Issues that span multiple iterations will consume all remaining capacity of the first iteration before moving on to the next one. Capacity is assigned on a first-come, first served basis – meaning that pre-existing issues won’t be moved. This is true whether you’re using story points or time-based estimates.

Assigned issues that consume more capacity than is available in an iteration will generate a warning (if those are turned on). We recommend that any assigned issues that have an estimation value higher than the capacity be broken down into smaller subtasks or spread across multiple iterations.

Note that issues with start and end dates that fall within a sprint will consume capacity, even though they’re not assigned to that sprint. When monitoring capacity, these issues are marked with the label x issues not assigned to a sprint.

What This All Gets You

Now you can accomplish several capacity-related tasks:

  • Measure the capacity of one particular team.
  • Measure one team’s capacity, then manage the effect of that team’s capacity on other multifunctional teams.
  • Determine how many hours you have available in a certain role or skill set, say project manager or developer.
  • Identify where you need to resource up or scale down depending on over-allocation or under-utilization.

The visual capacity warnings are updated live as you click and drag to add scheduling – even at the Epic level.
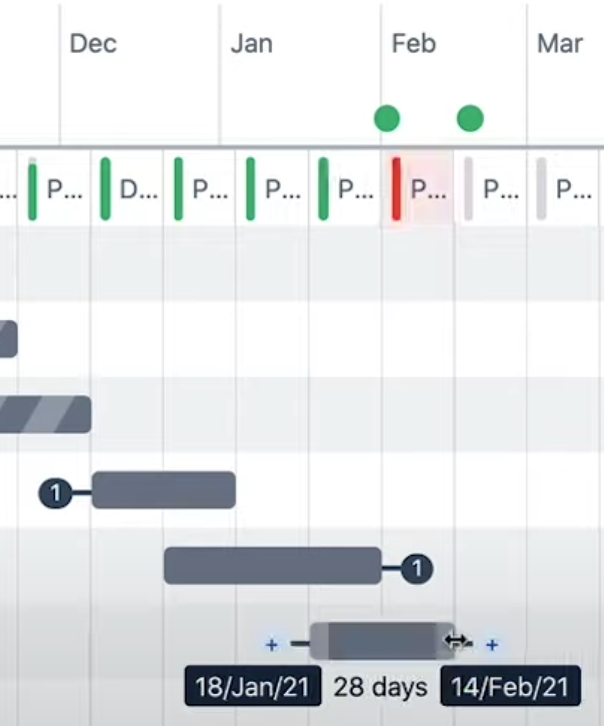
Jira Advanced Roadmaps epic level

Generally, most enterprises and other sizable organizations need to understand where they’re deficient in one particular skill set or resource.

But wherever the capacity is that you want to manage, structure your teams to ensure that capacity can be measured.

The team-based model is a more scalable model, which is increasingly important the larger your organization is, and helps you with larger-scale challenges like staffing. If, however, you have unique resources, skillsets that don’t exist as a pool, then team-based capacity planning can break down – you need interchangeable resources at all levels and skills. The ideal scenario for team-based capacity planning is tracking what teams can actually execute on, and calibrating their availability based on their past performance.

The truth is, even with effective team-based planning in place, most organizations – even enterprise or large departments – will still want some level of individual capacity planning, to know what’s happening with specific critical resources for their projects and if those resources are being over-allocated or under-allocated.

Setting it up

There are several key configurations for effective team-based resource capacity planning in AR.

Setting up the right teams: You can use AR’s Teams to reproduce your Scrum or Kanban teams, or you can group people into skill sets, resource types, etc. Just think it through, because whatever you can’t manage the capacity of something you don’t configure here.
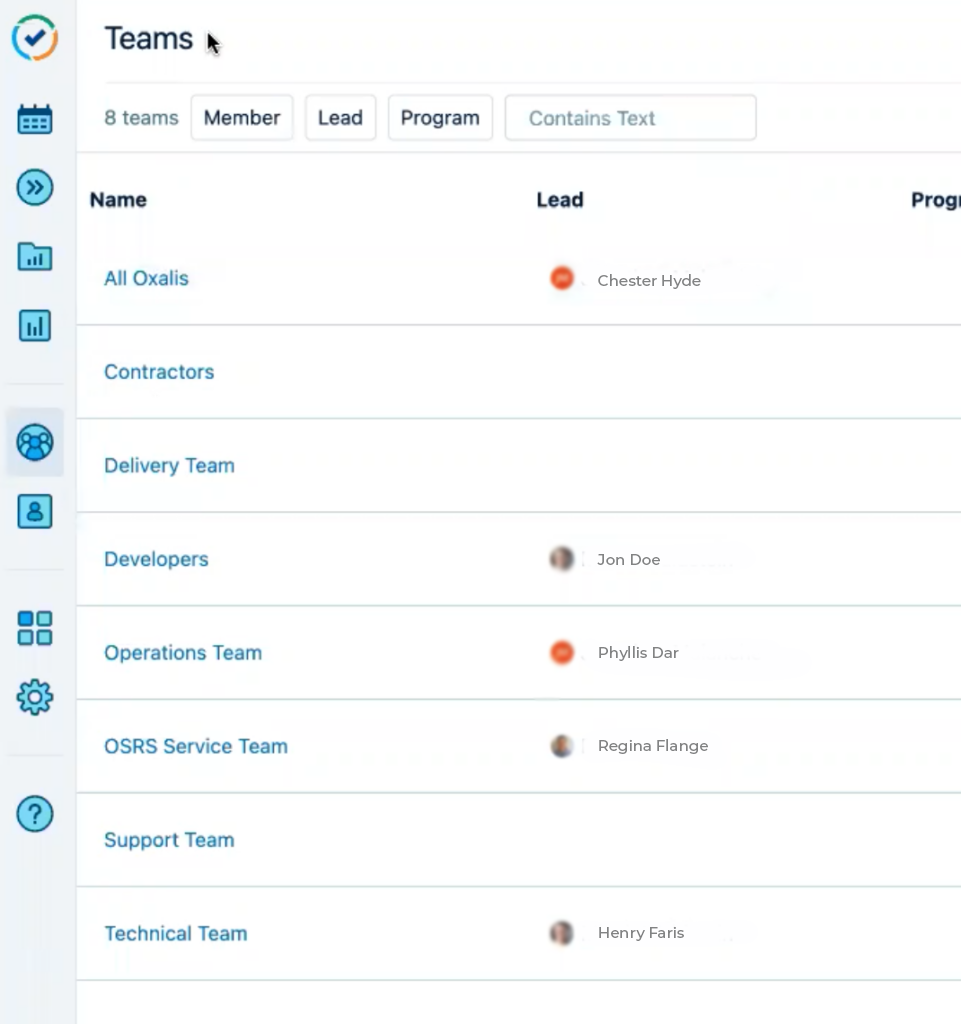
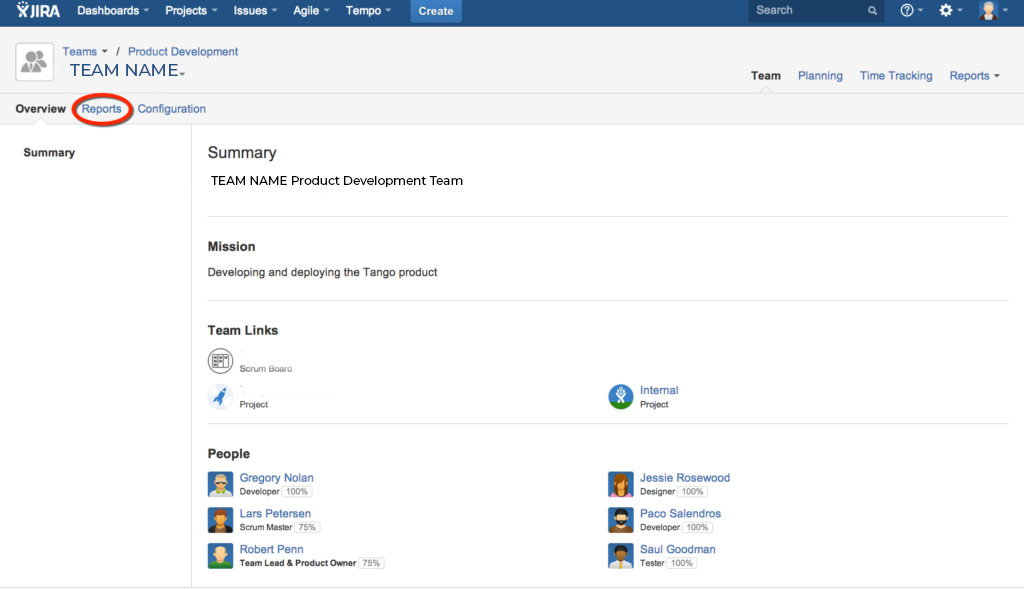
Effective team-based capacity planning in Advanced roadmaps

This is important even if your teams are cross-functional, like sprint teams of various types of resources, in which case your AR teams won’t match your teams in reality.

Choosing the right issue sources: Your plan must be configured to use the relevant team boards as the issue sources, so that the plan has access to the sprint information, like velocity.

Matching the team to the board: Each team in your plan must be configured to use the appropriate board as the associated issue source. If you create your plan using the team boards, this will happen automatically, otherwise you have to do it yourself.

Setting the team’s velocity (Scrum): If you’re doing sprints, each team’s sprint velocity must be set, since that is AR’s measure of actual work achieved; make sure it’s based on historical data, and not on guessing or wishful thinking.

Populating Story Points (Scrum): If you’re doing sprints, your teams must be strict about setting Story Points, since that tells AR how close to capacity each sprint is. Without this, you risk over-allocating sprints and not getting it all done.

Populating Original Estimate (Kanban): This serves the same purpose for Kanban as Story Points do for Scrum.

Keeping Work Remaining Accurate (Kanban): If AR thinks there’s more work left to do than there really is, then your resource capacity planning will be off. So everyone has to be diligent about updating the Work Remaining field.

Results and Benefit to the Organization

We’ve identified seven benefits your enterprise will experience when you are engaged in effective resource capacity planning. You will:

  • Keep all your employees working near their capacity, without either becoming a bottleneck or sitting idle.
  • Ensure resources are allocated where they’re needed most.
  • Keep all your projects, initiatives, etc., on track with realistic end dates.
  • Simplify re-allocating resources and work to different sprints or iterations.
  • Make it easy to slot new projects into timelines based on when the resources are available.
  • Improve hiring cadence by planning intake so new hires are in place and ready by the time they’re actually needed.
  • Schedule project milestones, code releases, and other delivery events efficiently because you see the impact on the teams involved.

In this data-driven world, capacity planning data opens the door to a new level of operational success.

Get started with the tools your team actually wants to use

Inevitably, enterprise-level tools like Tempo Planner, EazyBI, and Jira’s Advanced Roadmaps have more to offer on resource capacity planning than any one article can reasonably cover.

We get it. Your organization has unique workflows that constitutes smart solutions, freeing up valuable time for your teams to operate more efficiently is more important now than ever. The team at Oxalis is here to help you transform processes within your organization – get started today.
Don’t miss these posts:

Advanced Roadmaps for Jira: Overview and Comparison

What is Advanced Roadmaps for Jira?

Note: This article presumes some familiarity with Jira Software and agile concepts.

Advanced Roadmaps for Jira (“AR”) is a cross-project planning tool for Jira Software that is built into the Cloud Premium and Enterprise versions – as well as Data Center versions 8.15 and up – and expands the capabilities of the basic Roadmaps feature in Jira Software. Since Atlassian is continuously enhancing this invaluable tool, it’s easy to have questions about AR’s capabilities and how to best utilize them to optimize your business. Who is Jira Advanced Roadmaps for? What are its major benefits?  

Advanced Roadmaps for Jira expands your options and gives you greater control over your planning. 

  • Is your team’s planning taking up too much of your time hindering work productivity?
  • Are you sure your resources are being used effectively?
  • What can you accomplish with AR capabilities?

We will look at eleven improvements AR can instantly apply to your business model. Let’s dive into the specifics on Jira’s Advanced Roadmaps and navigate the most frequently asked questions you may be experiencing. We will also be comparing the pros and cons and key differences between Structure.Gantt, Big Picture, Tempo Planner, and Advanced Roadmaps. Which system will work best for you? See our Solutions Comparisons Chart below.

Overview of Roadmaps

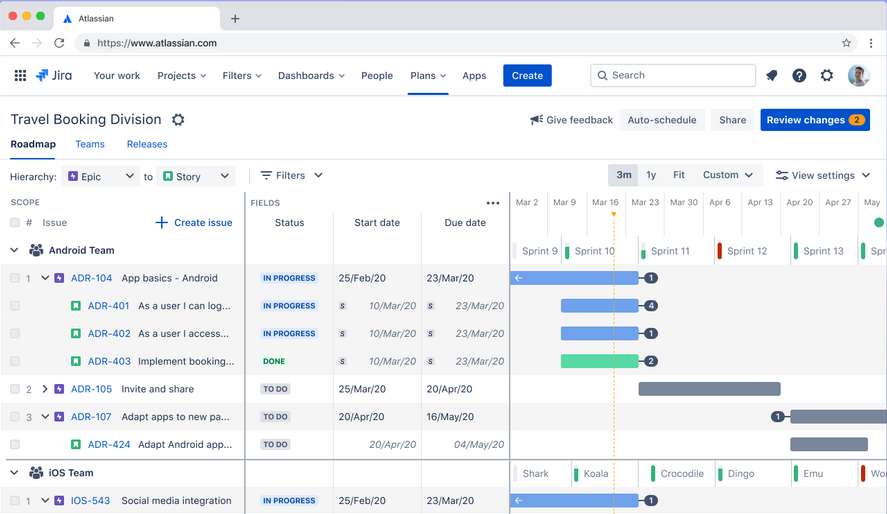
Roadmaps are a Jira Software feature that provides Jira with Gantt charts to visualize data from one team’s issues in a single project. They work with Epic, Story, and Task issue types, in a customizable interface that allows you to: see custom fields, each issue’s type, name, and status; view the Gantt chart including dependencies; and update issues without leaving the chart. And because a roadmap accesses your existing boards, projects, and filters, it always provides real-time data. These simple planning and dependency management features help your teams better visualize their work and manage it better together, so you can release more predictably while staying on target to achieve your goals.

Jira advanced roadmaps dasboard

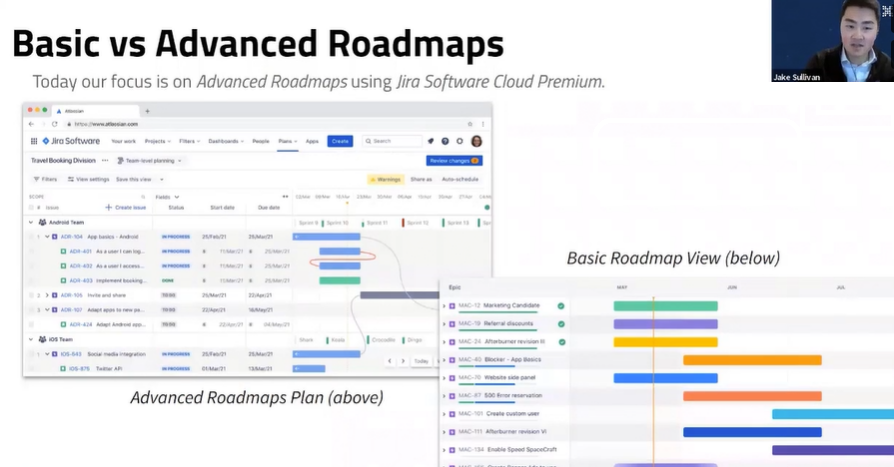
Building on the roadmap feature in Jira Software, AR enables project planning across multiple teams as well as providing additional features for larger organizations. 

What can you do with Advanced Roadmaps capabilities?

The benefits of this software are vast. You can plan work across all teams and projects, identify dependencies, adjust plans based on resource capacity, explore alternative planning scenarios, create custom plan views for differing audiences, and give everyone in each team the same visibility based on the real-time work they’re doing in Jira Software.

Advanced Roadmaps for Jira expands your options and gives you greater control over your planning.  You can: define only the issue sources, statuses, and releases you want your plan to incorporate; add as many additional levels to your issue type hierarchy as you want; build plans that include roadmaps for as many teams and projects as you want; and more.


Overview

11 Key Features of Jira Advanced Roadmaps

  • Create broader and more encompassing plans
  • Plan and track work strategically across multiple teams and projects
  • Help multiple teams collaborate together
  • Track the big picture
  • Enable a single source of visibility across planned work for everyone, so that priorities are understood and shared
  • Identify dependencies across large pieces of work that can impact your timeline (even if they live outside your plan)
  • Plan based on team capacity and velocity, scheduling work at a pace your teams can handle to ensure that your plan is attainable
  • Empower teams at scale
  • Manage competing priorities
  • Set business goals and track progress towards them
  • Explore alternative scenarios, whether to determine more effective arrangements of work or to determine how a potential future event might affect your capacity, timelines, etc.

Who Should Use Advanced Roadmaps for Jira?

Generally speaking, large to enterprise businesses with large portfolios of work will benefit most from AR’s advanced planning capabilities. Any user with permission can also create a plan for personal use or for team/project purposes to track dependencies at any scale.

Existing Jira Software Users

If you’re already using roadmaps in Jira Software, and find yourself up against the following limitations, Advanced Roadmaps will let you plan larger.

Solve Common Problems

If you’re not already using Jira Software, Advanced Roadmaps for Jira can help you solve some problems that organizations often face.

Are your resources being used effectively?

Project managers and administrators (along with scrum masters and those in SAFe roles such as product owners and release train engineers) are often asked when features, upgrades, and systems can be delivered. Even in an Agile environment using scrums, with deliverables broken into sprints, you still need to know when they’ll be delivered, whether they’re on track, and if you have enough resources.

AR shows your forecasted release dates so you can see dependencies and capacity bottlenecks, and understand the current situation as well as future activities and their statuses. It also lets you play with different versions of your plan to see how various factors may affect delivery dates.

Is planning taking up too much of your time?

Every hour spent creating spreadsheets or Gantt charts is time not working towards releases – and by the time that hour is done, employees have done more work that makes those spreadsheets or Gantt charts out-of-date. Unpredictable factors like holiday plans and illness, or team members being reassigned between projects, can quickly render a static plan obsolete and require inconvenient rework.

Advanced Roadmaps for Jira provides a clear view of who’s doing what, and when, showing project progress and backlogs based on real-time data. The moment someone finishes a task early – or misses a due date – you’ll see how that affects the rest of your plan. The Teams and Capacity features let you group, filter, and allocate work based on assigned team members and their availability as it changes.

Spending too much time providing updates to higher-ups?

Stakeholders who aren’t involved in the day-to-day detail of a plan still need to know who’s working on what, and often want meetings to get an update on the current status. Again, those meetings take time away from productive work toward deliverables.

AR enables different views of a plan that are tailored to specific audiences, so each level of management can check real-time status at the level of detail they need, whenever they need it. You won’t have to trade off progress visibility for team overhead. 

Features in Advanced Roadmaps for Jira

Plans

Plan in jira advanced roadmaps

A plan combines the roadmaps of multiple teams working across multiple projects, and ladders them to company-wide initiatives. It provides a shared source of truth that outlines organizational goals and communicates a path for teams to achieve milestones and key results.

The benefit of using a plan is that it establishes the bigger picture and shows how a team’s work relates to the work of other teams. It visualizes how each team contributes to broad organizational goals, and enables you to identify potential bottlenecks and conflicts so you can adjust before they cause problems.

Unlimited Issue Type Hierarchy

Unlimited Issue Type Hierarchy

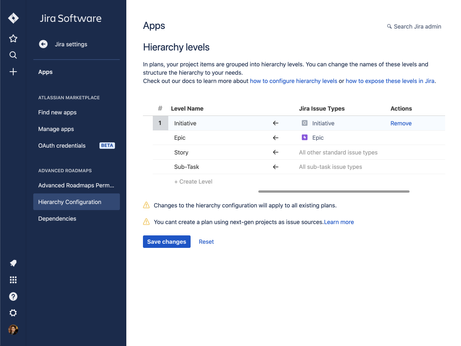
A hierarchy connects small, process-based tasks to cross-functional deliverables, and escalates them to broad organizational objectives. Depending on how your work is structured, hierarchy levels represent different levels of detail in a plan’s scope and show how they’re related.

AR allows you to ladder work from multiple teams and projects to company-wide initiatives. With the freedom to create unlimited levels of issue type hierarchy above Epic, your teams and organization can plan smarter.

Saved Views and Smart Filters

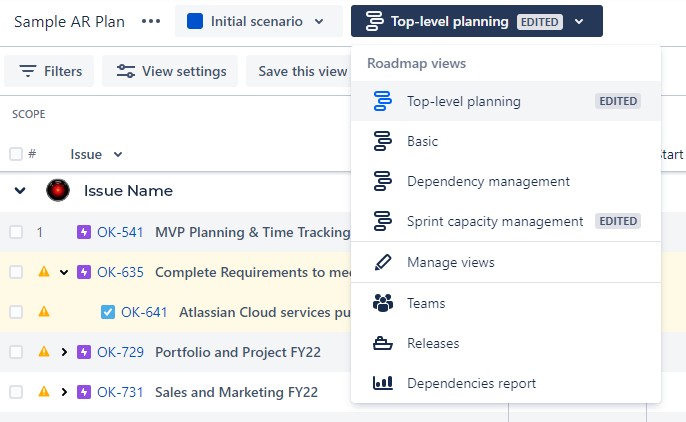
Saved views allow you to tailor your plan for different audiences. Customize your plan to emphasize different aspects, then save it as a view that can be easily accessed at any time.

Saved Views and Smart Filters

This is particularly useful for large, cross-functional projects, where different stakeholders view your plan with specific concerns or needs in mind. With a single view of important initiatives, you can plan and track how you’re making progress on the big picture across multiple teams.

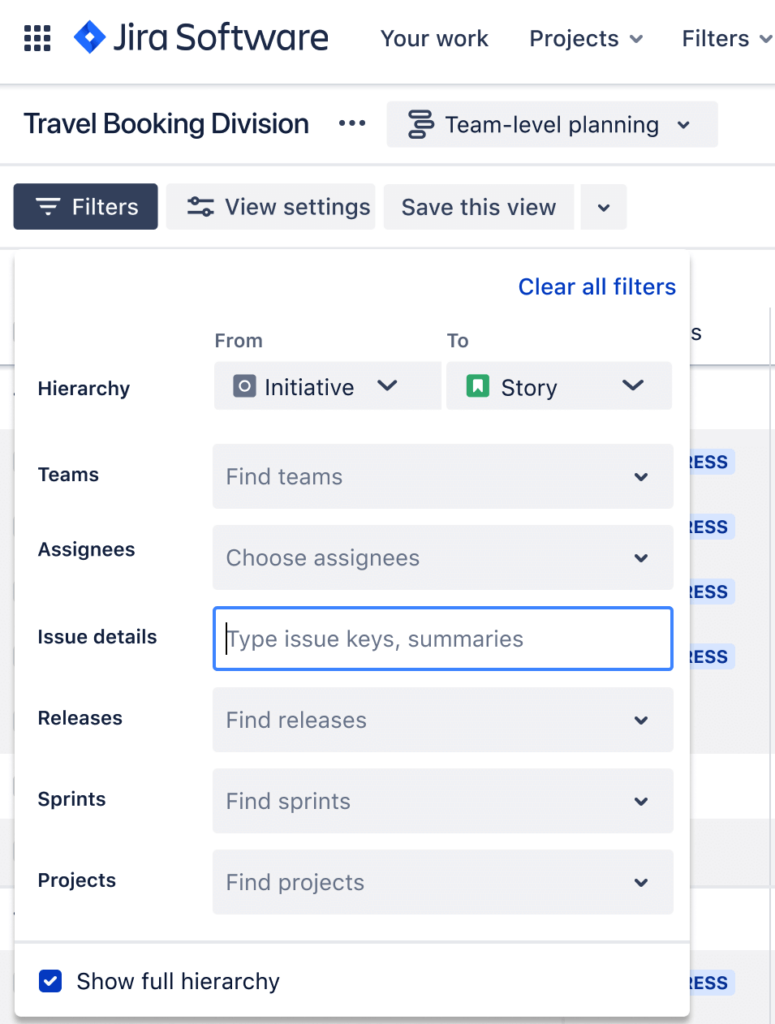
Smart filters ensure you can always share the right data of your roadmap for every stakeholder.

Smart filters Jira Software

Find and refine your roadmap by searching for keywords and filter by assignee, status, label, or issue type.

Together, smart filters and saved views let you keep everyone at every level up to date on the plan – in the exact way they need.

Dependencies

Jira Advanced roadmap dependencies

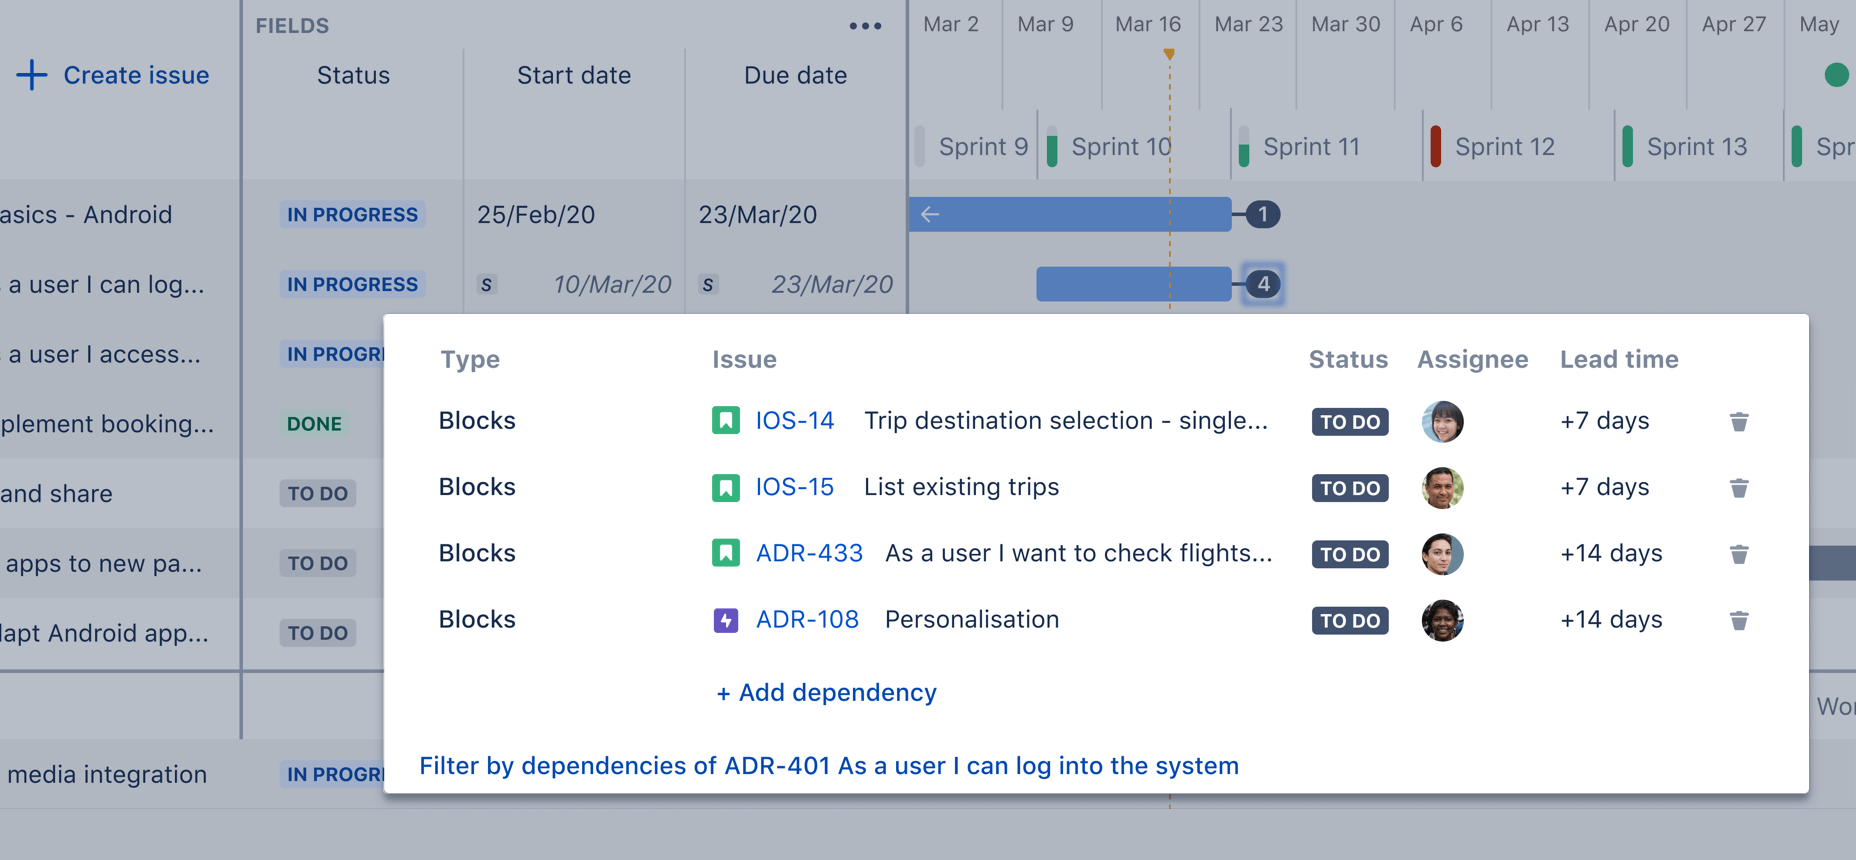
Dependencies show the relationship between issues in your plan, such as contingencies and blockers. A dependency can be incoming or outgoing, revealing when an issue blocks other issues, or is blocked, and what issues to prioritize to ensure that work progresses. They are shown on the timeline by badges, columns, or lines. 

Visualizing and understanding dependencies is vital when project or program managers determine a critical path in the roadmap. When dependencies are thoroughly mapped, a team can adapt and plan for alternative paths. Track dependencies across teams, projects, and initiatives to get ahead of blockers across your organization.

You can also view dependencies in the Dependencies report tab, which visually maps relationships between issues in your plan.

 Alerting: Advanced Roadmaps will alert you if a team is booked over the assigned capacity, or if a project is past its end date yet still in progress.

Capacity

Advanced roadmap team capacity

Capacity reveals the units of work that a team undertakes in a given period of time. It can be used to estimate a team’s ability to complete work by a particular milestone, and is invaluable for evaluating risk when making key decisions.

Capacity is added to the plan by team and domain leads who regularly assess their team’s availability, resource allocation, and the prioritization of other projects. Keep your goals on track by accounting for whether your teams have bandwidth to complete the work they’ve scoped. See multiple teams’ capacity on a sprint-by-sprint basis.

Scenarios

Advanced roadmap scenarios

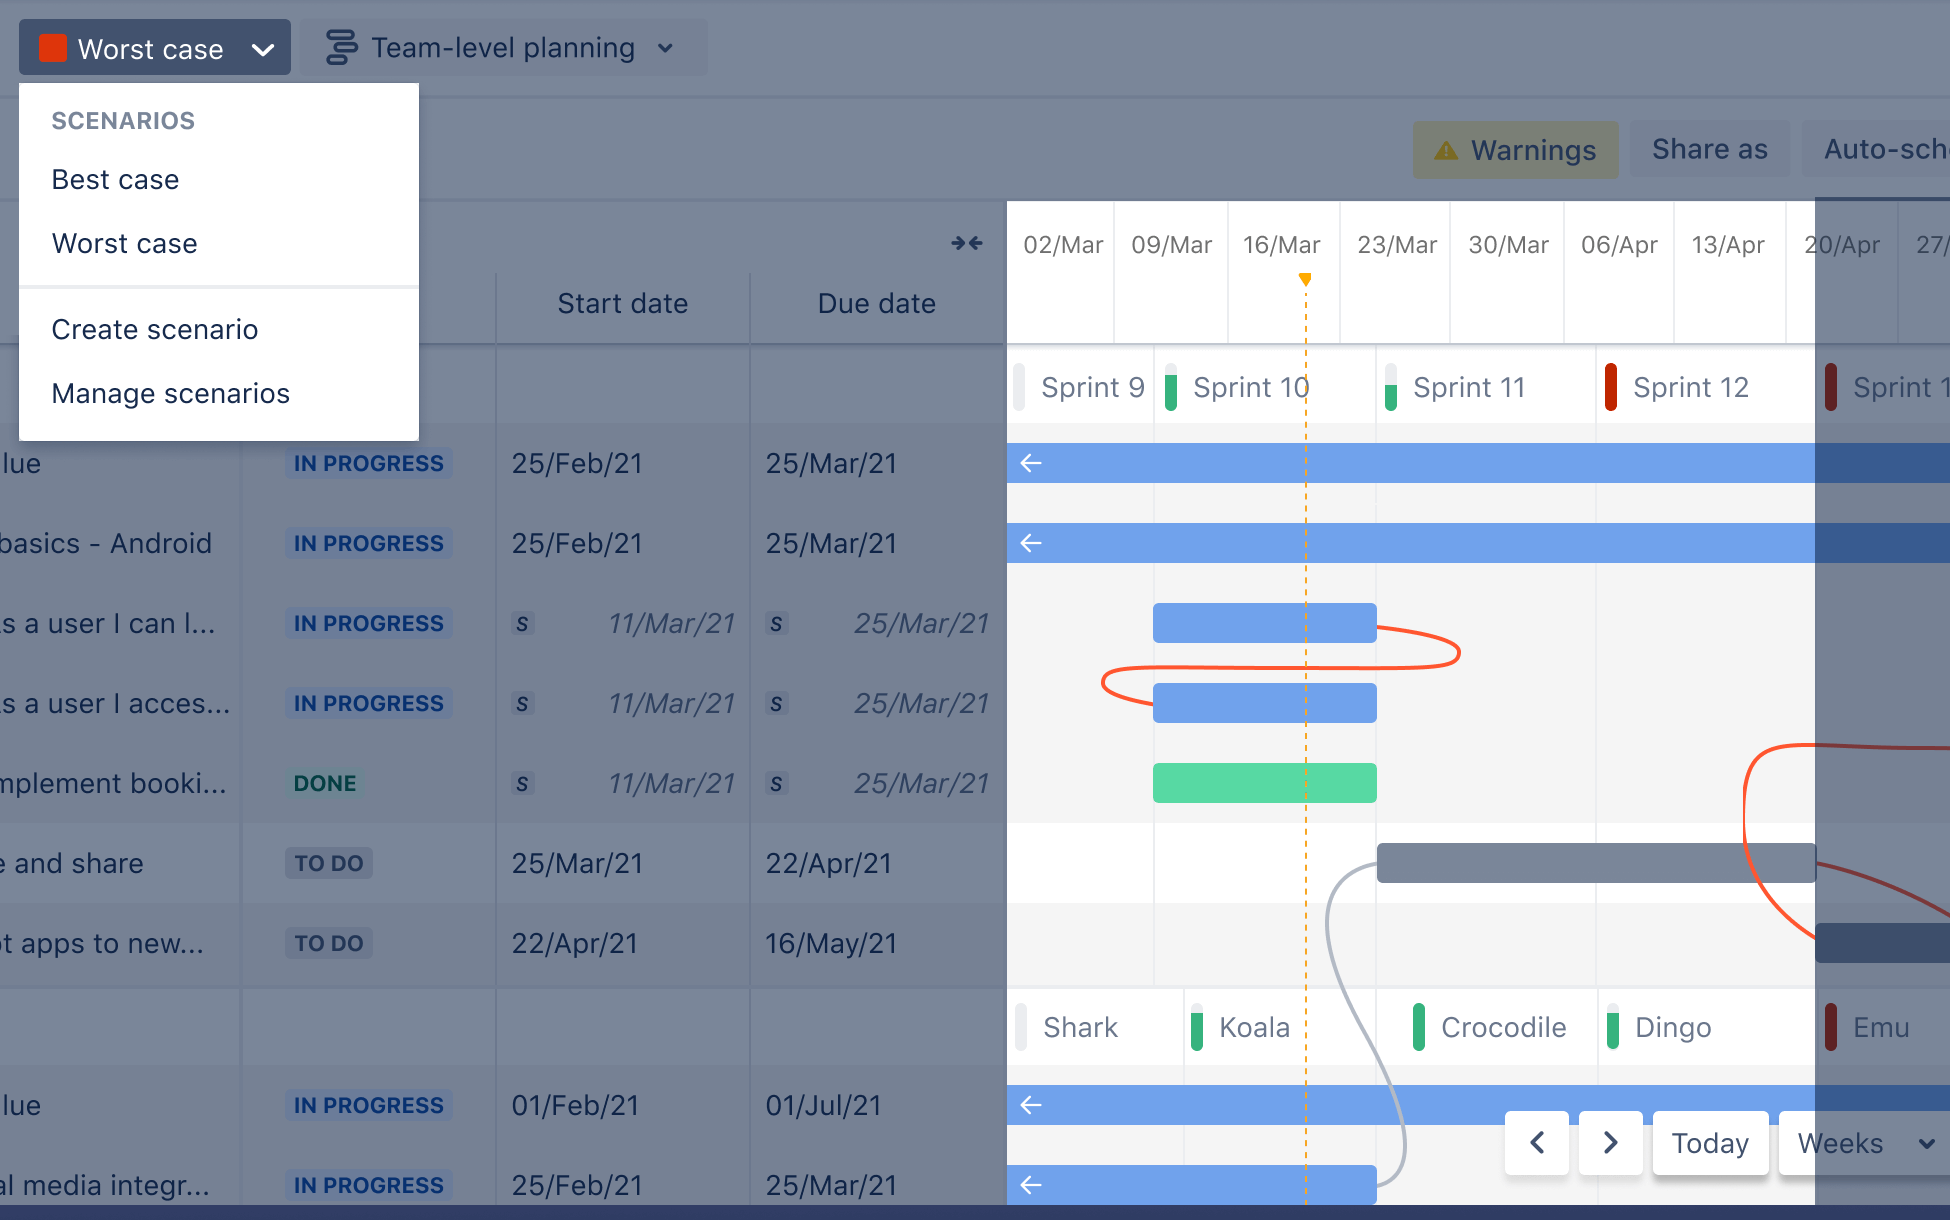
Scenarios allow you to explore alternative paths to milestones or project completion. Planning with different scenarios allows you to adapt with minimal disruption. You can aim for your best case, plan for your worst case, and be prepared for anything in between.

A scenario is like a copy of your plan, complete with its own set of data, and any changes you make won’t affect the “live” plan unless you choose to save them to it.

Issue sources and Exclusion rules

Issue sources determine what data will be used in Jira Software to create a plan. They outline the work to be done and the problems you’re trying to solve. Issue sources are first selected during plan creation and can be adjusted at any time.  They include boards (scrum for planning sprints or kanban for work planning based on available weekly hours), projects, and filters (saved searches in Jira Query Language).

Exclusion rules allow you to refine your plan’s issue sources so the most relevant issues are displayed. Depending on your focus, you can set rules to exclude specific issue types, statuses, or releases. You can also adjust how long you’d like completed issues to stay in your plan.

Together, these parameters help you right-size your plan and prevent irrelevant data from cluttering it up.

.


Jira Advanced Roadmaps Webinar On-Demand

Watch our Jira Advanced Roadmaps Webinar On-Demand


Advanced Roadmaps Compared to Similar Solutions for Jira

As you might imagine for something as vital as planning tools, Advanced Roadmaps is not the only solution available for Jira. Atlassian’s marketplace offers a number of alternatives, and here we’ll take a look at three popular choices and how they compare to AR.

All these products have a wide array of features, and it’s beyond the scope of this article to touch on all of them. We’ve tried to highlight the significant features that in our experience will affect the most organizations.

BigPicture

big picture screenshot

BigPicture describes itself this way: “BigPicture is the leading Portfolio, Product, and Project Management application for Atlassian Jira. It gives managers unprecedented clarity of information, helps them neatly visualize even the most complex initiatives, smartly distribute workload and allocate resources, efficiently coordinate work of teams, easily report on progress, and ensure perfect strategy-to-execution alignment at all levels. The system supports agile, classic, and hybrid management methodologies and allows for combining them freely at the portfolio level. BigPicture is the go-to PPM solution for any forward-thinking organization before, during, or after digital transformation.”

Three Basic Concepts

BigPicture is a distinctive solution that can take some time to understand, so the following concepts should give you a good overview.

The Box

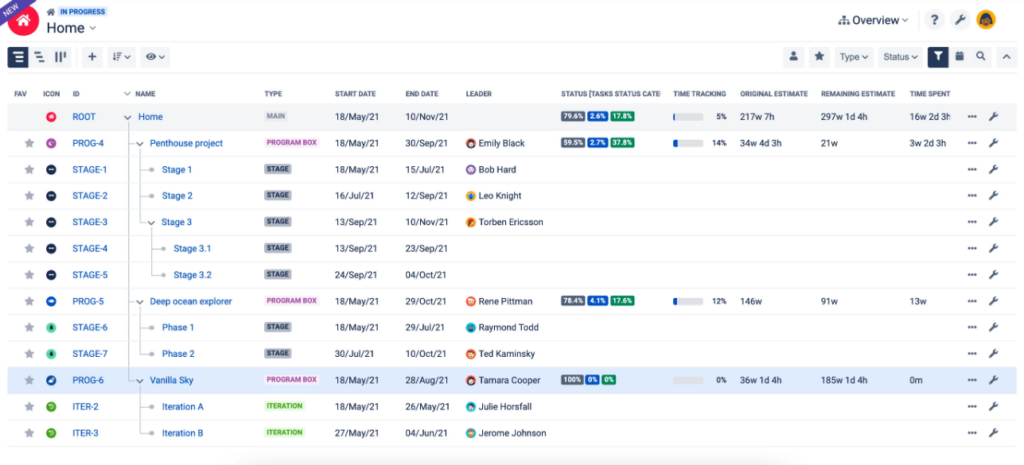
The fundamental organizational concept – and data object – in BigPicture is the Box. A Box can be thought of as a fancy customizable data container, or folder, that can contain a full spectrum of project management objects for differing PM approaches (e.g., you can mix Agile and Waterfall), and that can contain other Boxes. The possibilities for Boxes include: SAFe ART, Portfolio, Task, Resource, Risk, Scrum project, stage, iteration, and more. Each level of your Box hierarchy comes with its own set of views on the state of the work in that Box. The point being, at each level you can get “the big picture” in a variety of ways, such as that level’s own Gantt chart, or Scope overview, etc. — and each of those views can be customized. BigPicture comes with a set of built-in Box types, but you can create your own. Each Box type has its own default Status as well as one or more default parent Box types, enabling default hierarchies.

The Task

In BP, all Jira issue types are called Tasks. Separate from the Box hierarchy is the Task hierarchy, which is an ordered list of elements BigPicture uses to determine the hierarchy. You can use built-in elements like Project, Epic, Version, Component, and Sprint, or you can use a Jira link type to define the parent/child relation. By default, the Task hierarchy is defined per Box type, but an individual Box can be configured with its own Task hierarchy.

The Module

A Module is like a specialized filter that shows a distinct view of a subset of the data in a Box, such as Overview, Gantt, Scope, Board, Roadmap, Resources, Team, Risks, Calendar and Reports. Each module can be turned on or off for each Box type.

As an example, the Resources module displays which individuals and teams have been allocated to what, and you can freely change their allocation or the tasks they are assigned to directly in the add-on. These changes are synchronized not only with Jira issues but also with other relevant modules like Gantt.

Putting Them Together

When you combine the top-level organizational capacity of Boxes and the Box hierarchy with the issue-level organization of the Task hierarchy, and the variable choice of Modules, it should be easy to see how BigPicture could be customized to build a solution that fits your organization’s needs fairly well. Of course, with great flexibility comes great configuration setup time, so be realistic about whether your organization and teams will be able and willing to put in the time; paying for a highly flexible solution but not using that flexibility fully can be a waste of money.

BigPicture Server vs. Cloud

BP Cloud depends on the functionality and API of Jira Cloud, which do not offer everything Jira Server offers, so there are a number of relatively minor features lacking from BP Cloud. These include: in the Gantt box type’s Scope Module, the Detail View; the “status” field cannot be edited inline; there are no JQL hints as you type in Search Box and Quick filters.

For the full list, see the BigPicture documentation.


BigPicture vs. Advanced Roadmaps: Key Differences

BigPicture Pros
  • Allows multiple management methodologies and frameworks (e.g. Waterfall and Agile) in the same context, rather than having to choose one for each project as in AR.
  • The ability to specify PTO including holidays and vacation time, which AR lacks.
  • XML and CSV exports are available, whereas AR only has CSV.
  • Comes with a REST API, which AR does not – though Jira does.
BigPicture Cons
  • The Kanban board is underdeveloped compared to the Scrum board; each type is equally well-developed in AR.
  • The estimated time in Jira issues is not pulled through, though Story points are.

Enterprise version

BigPicture Enterprise is an “expansion pack” that adds a handful of useful features onto BigPicture. Some of these additional features include: more preconfigured Box types since BP comes with only three (the additions include Agile project, Classic project, Hybrid project, Portfolio, Program, SAFe, and more), unlimited custom Box types, ability to relabel modules, unlimited scenarios per Box. Generally, we find that BigPicture Enterprise isn’t worth the additional cost, especially for teams who have a standard and consistent usage of Jira.

BigPicture vs BigPicture Enterprise

Big Picture Enterprise has additional features BigPicture does not offer, such as:

  • Additional stock Box types, including Portfolio, Waterfall project, Hybrid project, Agile project, along with the freedom to configure your own Box types
  • Tempo and Trello integration
  • Multi-level rollup (project up to a program)
  • View and report on multiple programs at once
  • Unlimited configuration
  • Configurable module names
  • Unlimited what-if scenarios

Read More

For more information on BigPicture, start with the app’s page in the Atlassian Marketplace, which contains links to BigPicture documentation and more.

Structure.Gantt

jira software structure.gantt

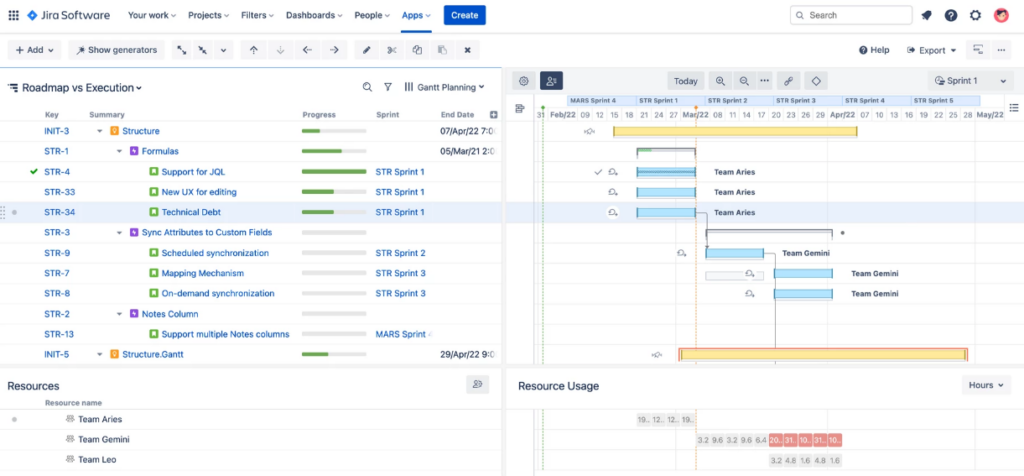
Structure is a Jira plugin that uses real-time issue data to easily visualize and track the status of multiple projects, across an entire portfolio. Within Structure, work can be grouped by and filtered on field values to organize information based on common themes or groupings.

The extension Structure.Gantt (“S.G”) – a separate product – provides additional modules and functions, including the Gantt and Resource views. S.G allows progress to be visualized through the use of Gantt charts by issue to identify potential problems or sticking points. The Resource module shows resource allocation by a user based on previously defined capacity metrics to help visualize resource capacity across the organization. Without S.G, Structure isn’t a viable alternative to Advanced Roadmaps for Jira.

Structure.Gantt enables new components: a Gantt chart and a Resource Planning view.

Scheduling: S.G charts allow either Automatic or Manual Scheduling. Automatic Scheduling uses the Project Start Date, Issue Durations, and Dependencies to determine how the issues should be scheduled in a waterfall. Manual Scheduling places issues on the Gantt chart based on their Due Date and Duration.

Resource Planning: Adds to the screen a list of users and a calendar view of their assigned work based on duration.

Key Concept: Structures

Structure is so named because one of the key features is a hierarchical arrangement of Jira issues in table format, called a ‘structure.’

Structures can be defined manually, or using preset choices like traditional agile hierarchy or issue status, or using dynamic generation mechanisms like JQL searches and boards. Each structure can be modified with grouping, filtering, and sorting, and can be extended to include child issues. Structures display as tables, with issues for rows and issue data for columns; in addition to Jira fields, column types include Progress, Totals, and Formula.

You can create a private version of a structure to play around with, and save a snapshot of that private version called a Perspective which you can share with other users or save as a bookmark for future use. Structures can also be grouped into folders for ease of organization and navigation.

Highlighted Features 

  • Scaled Agile Implementation: scale more smoothly, by showing the essential information on any level, be it portfolio, program, or team.
  • Unlimited Hierarchy: The ability to automatically apply the issue hierarchy as defined in Jira. Users can also create their own hierarchies manually to align to personal preferences for issue layout within Structure. 
  • Portfolio Views: Issues can be pulled from multiple or all projects within Structure, which provides the ability to visualize all important issues and milestones across the entire organization, in one place.
  • Pre-Set and Custom Templates: Save time and effort by creating Structures as templates for repeated use. Users can easily clone Structures to continue building on the base configuration for different purposes or views. 
  • Visualize Relationships: View dependencies and issue linkages with visualized relationships. Create new dependencies or visualize those in existence with drag and drop functionality. 
  • Aggregated Field Values: Sum up all time spent on issues in a project or in an Epic, useful for comparing high-level estimates with actual time logged.

Structure.Gantt vs. Advanced Roadmaps: Key Differences

Structure.Gantt Pros
  • Due date is calculated using task duration estimate and capacity, whereas Due Date is a separate field in AR. This is mostly a matter of preference.
  • Rest API available, which AR lacks.
  • Customizable calendar allows the ability to include workday exclusions to represent PTO; AR lacks support for PTO.
Structure.Gantt Cons
  • Due date is calculated using task duration estimate and capacity, whereas Due Date is a separate field in AR. This is mostly a matter of preference.
  • In order to use Gantt charts and engage in resource planning, you have to pay for the Structure.Gantt product, which costs as much as Structure. AR, of course, is an all-in-one solution.
  • Dependencies are displayed on an issue by issue basis, not by resource; AR can link projected capacity to demonstrate dependencies.
  • Capacity is tracked through issue status and issue related progress, not by individual or team resource; AR offers some ability to manage capacity on an individual level.
  • IE browser is not supported.

Structure Server/Data Center vs. Cloud

The Cloud version lacks a number of features present in the Server and Data Center versions, including:

  • The maximum structure size is limited to 10k rows.
  • Inline editing is not available for some fields.
  • Sharing of Perspectives is unavailable.
  • Users cannot search for structures by owner / permissions.
  • Issues from all projects are available to all structures.
  • All users with access to the app can create/edit structures.

For a fuller list of the differences, see the Structure documentation.

Read More

For more information on Structure and Structure.Gannt, start with the Atlassian Marketplace’s pages for the app and for the extension, which contain links to documentation and more.

Tempo Planner

Tempo planner dashboard screenshot

Tempo describes its Jira app this way: “Tempo Planner is a capacity and allocation tool, perfect for project teams with strict deadlines where resources are allocated based on availability, role, and more.” So that should give you a sense for where it focuses as a solution.

Tempo Planner (“TP”) is a more targeted product than the others we’re examining, focused on enabling users to allocate the time of resources against tasks and projects. Within that wheelhouse, it offers good flexibility and options. If you’re looking for additional functionality like managing Work Breakdown Structures or planning across a larger scale like a project or initiative, TP may not meet those needs. In fact, TP uses the word “plan” to refer to a timeline of work allocated for a resource, and NOT a larger scale assembly of those timelines for a project or initiative.

Note that if you’re already using Tempo Timesheets for Jira, you’ll get more out of Tempo Planner than if you’re using another solution for time tracking/reporting.

Most Common Use Cases

According to Tempo, its Planner product is used most often for these use cases:

  • Resource Capacity: Balancing workloads and understanding current resource allocation.
  • Estimate Need for New Projects: How many more new initiatives can you fit into your schedule, and does your team need more projects.
  • Allocate Resources: Assign resources to tasks based on roles, availability, or teams.
  • Measure Against Plan: Compare planned time to actual hours logged, with easy reporting to add/remove staffing (requires Tempo Timesheets).
  • Learn and Improve Efficiency: Look back at previous projects to better estimate future projects, including project profitability.

Highlighted Features

  • Plan multiple scenarios using actual hours pulled from Tempo Timesheets (if you use it).
  • Rest API available as well as export/import options to CSV and XML.
  • Schedule individuals and teams on a project, task, or ticket level. Allocate or request resources for high-impact initiatives while ensuring workloads are balanced and realistic.
  • Track the allocation of every team and user for weeks or months into the future.
  • Allow multiple users to plan time on the same issue, and filter any set of users you need.
  • Leverage various Resource Planning views to quickly see the current state of all projects and resources. Use the Capacity Report to effortlessly review several commitments at once and simplify progress monitoring.

Tempo Planner vs. Advanced Roadmaps: Key Differences

Tempo Planner Pros
  • Full, easy integration with Tempo Timesheets, which provides a number of advantages over Advanced Roadmaps, like planning with actual work hours vs. estimates.
  • Filters provided for resource search, resources listed with name, role and discipline; AR has capacity reports capacity by team, but not the individual resource (though there are partial workarounds).
  • Rest API available as well as export/import options to CSV and XML. AR only offers export as CSV, and no API.
  • Holidays and PTO included in resource capacity, which AR lacks.
Tempo Planner Cons
  • Lacks the ability to plan with issue hierarchies such as Work Breakdown Structures – planning is focused on allocating time to resources. Issue hierarchies can be created using links in Jira, and then the issues can be imported to create plans, but there’s no way to manipulate the structure in TP. AR, of course, being built in to Jira, gives you full access to issue hierarchies.
  • Limited ability to view cross project dependencies by resource; a partial solution is possible with filters and reports, whereas AR offers the ability to link projected capacity to demonstrate dependencies.
  • Changes to Jira issues made in a plan are not synced back to Jira.
  • No Gantt charting, which AR has built-in.

Tempo Planner Server vs. Cloud

The Server version has a number of features lacking in the Cloud version:

  • Members can be added to a Team using Jira groups.
  • Member permission roles can be added to a Team using Jira groups.
  • Staff members can be organized into roles, locations, working schedules, and holiday schemes.
  • Cloud has only Capacity Reports for teams, whereas Server can also report on staff capacity by role, user, location, program, account, and project.

Read More

For more information on Tempo Planner, start with the app’s page in the Atlassian Marketplace, which contains links to TP documentation and more.

Solution Comparison Table

Note: This table serves as an overview, but should not be relied on for purchasing decisions. Always identify your organization’s and team’s must-haves, and enlist expert assistance to determine for certain – and at the level of detail you need – whether a solution meets your needs.

ItemsBigPictureAdvanced RoadmapsTempo PlannerStructure + Structure.Gantt

Modules
Roadmapping (planning)Limited capacity for large-scale planning
Gantt chart
Resources
Teams
Work Breakdown Structure
Reporting √

Hierarchies (Work Breakdown Structures)
Unlimited hierarchy depth
Configurable views
Filtering

Selected functionalities
Are portfolio-, program- and project-level plans (roadmaps) linked together?
Sync- and re-sync with JiraN/A
What-if scenarios (sandbox before committing changes)
Track progress of projects/programs
JQL filters
Dependencies between issues
Milestones / Releases
Drag & drop tasks into plans

Resource planning
Skills
Story points
Capacity planning
Holiday plans
Vacation plans√ by adding exceptions to team members√ by adding exceptions to team members

Project management paradigms / methodologies
Project/program-level management
Agile (Scrum & Kanban)
Portfolio-level management
Mixed methodology teams (Scrum/Kanban)
Iterations (Scrum)
SAFe®
Waterfall

Import/export features
APIJira has an API, but AR does not
Supported file typesExport to csv; import available through Jira
csv, xls, xlsx, pdf

(a) xls, printable page – with Structure for Jira

(b) pdf, svg – with Structure.Gantt
Sample featuresNo export or import to BigPicture is possible without paying for the extension
BigTemplate.

Share a read-only link to a plan or embed an iframe.

Export/import plans from team timelines to csv files.

(a) You can download the structure that you see on the screen as an XLS file.

(b) You can produce a PDF or SVG file with your Gantt charts using configurable export.

Business data & Annual pricing
500 users
Bigpicture: $10,795 BigTemplate $3,745

$7705

$9020, Gannt.Structure $2655 = total $11,675
Jira Data Center, 100 users, Atlassian Marketplace
Bigpicture: $3,750 BigTemplate $625
1-500 users in Jira Software DC $42,000
$3300

$2780, Gannt.Structure $900 = total $3,680
Jira Cloud, 500 users
BigTemplate $3,745
Jira Software Premium: 500 users $51,000
$7705

$9,020, Gannt.Structure $2655 = total $11,675
Developer
Appfire (Platinum Marketplace Partner)

Atlassian

Tempo (Platinum Marketplace Partner)
ALM Works (Platinum Marketplace Partner)
Pricing is as of March, 23rd 2023

Contact Us

Recommended blog posts

As you know, Jira’s Advanced Roadmaps features and capabilities are complex. But that doesn’t have to mean AR has to confusing for your business. Oxalis is an Atlassian Platinum Solution Partner, which means we can help guide you through these services and best determine the options for your business: