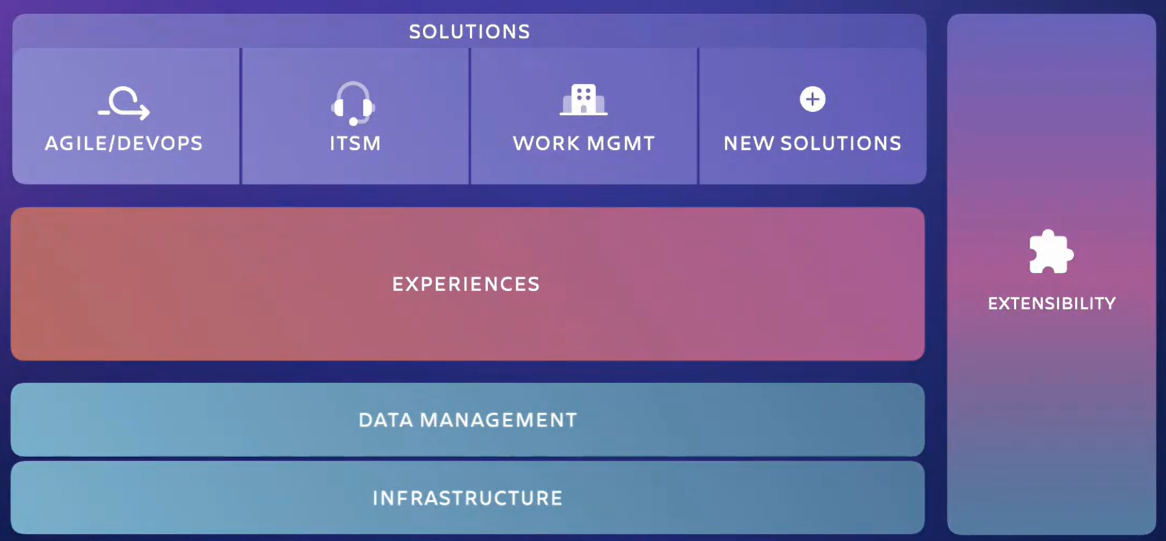
DevSecOps Security Best Practices
The DevOps software development model has become increasingly popular, but it doesn’t inherently lend itself to the level of security required these days. DevSecOps builds on the value of DevOps, preserving its throughput and stability while integrating security best practices.
At Oxalis, we frequently work with healthcare and government organizations, whether states, defense contractors, or the DOD directly. Sometimes we develop the software and other times we help our clients develop the software, but in both cases, we take security seriously in our software development processes. Security in software development doesn’t tend to excite many people outside the software security industry, so let’s be clear on why it is always important.
Table of Contents
Why You Should Prioritize Security
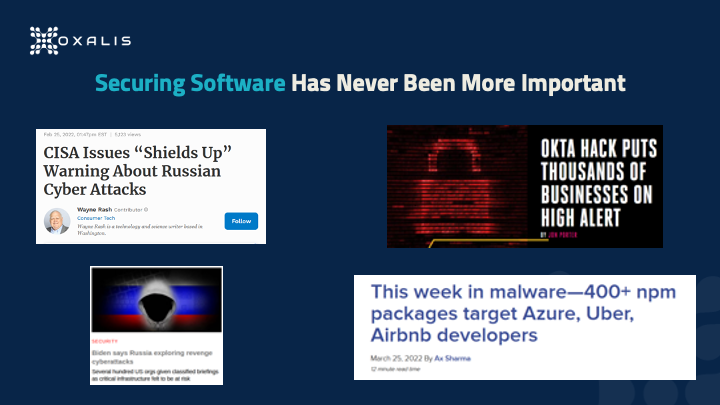
Threats have been increasing – from malware, bots, hackers, and more – and are hitting much more than just the largest targets. It’s not only the software products themselves that are the targets: recently there was a supply chain attack on Azure developers via malicious NPM packages. And since the goal of many attacks is simply to gain some form of access, even development-adjacent platforms such as documentation are targets, as we’ve written about in Confluence Remote Code Execution Vulnerability: Everything you need to know about it. With the conflict in Ukraine, the number of state actor attacks has also greatly increased.
For any given week we could provide another ten example headlines. The fact is that it doesn’t matter what your role is in software development – whether you are a developer, a tester, project manager, program manager, or product manager of software – software security is now part of your job. It can’t be outsourced to a security team at the 11th hour to give their final blessing. This article covers how you can include security as part of your full lifecycle without interrupting the developer experience.
DevOps Overview
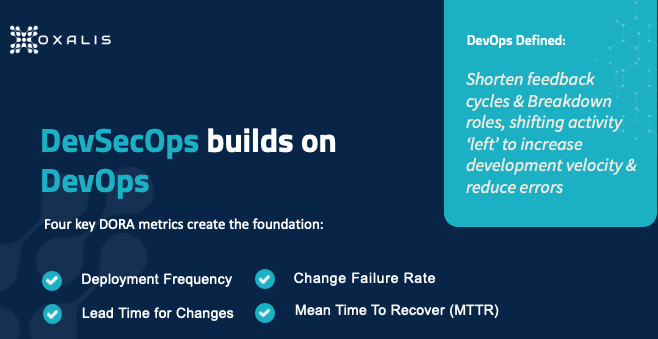
DevSecOps builds on top of the foundation that the DevOps revolution has put in place, so you really need a common working understanding of DevOps. There is no central definition, but generally speaking, DevOps is a set of practices intended to enable an organization to release software updates more often without sacrificing quality. It accomplishes this by taking activities traditionally occurring toward the end of the development process and “shifting them left”, a reference to the fact that in a left-to-right process diagram, steps to the left occur sooner.
One major effort to pin down the principles driving DevOps comes from DORA, the DevOps Research, and Assessment team, which is a research program acquired by Google in 2018. DORA studied software teams that deliver the most value, fastest, and most consistently, to analyze practices those teams optimized. In 2018 the program identified four metrics, shown in the graphic above, that have been widely adopted as the standard for DevOps teams. The left side represents throughput – release frequency and the development team’s speed – while the right side represents stability – risk and failure management.
Deployment Frequency
How often are you making new releases of your software or pushing new builds into production? In the classic enterprise environment, deployments may be monthly or quarterly, requiring significant processes to implement. In the DORA-based DevOps model, deployment is ongoing, with frequency measured in times per day; organizations leading in DevOps may deploy 100 times in a day. The benefits include improving time-to-value for customers, and reducing the risk from production failures because changes are smaller and easier to fix.
Time for Changes
In a monthly or quarterly release cadence, each release comes at the tail end of a three-month process, so if you are a developer who misses the scheduled cut-off date, your change has to wait for the next release. Conversely, in the rush to meet that cut-off date, you’re more likely to do poor-quality work. DORA’s metric prioritizes reducing the time from the first code commit to the time of code deployment. This enables faster bug fixing and greater responsiveness to changing user needs and external events, which makes your product more useful and valuable to users.
Change Failure Rate
Of course, the chief reason long development cycles exist is to reduce the risk of failures before moving into production. Greater throughput must therefore be accompanied by robust testing of all types that are relevant to the product, otherwise, you risk creating a failed engine. It’s also vital to carefully define what a failure is for your organization, teams, and products – that definition will drive employee behavior (in order to meet the desired metric), so if you make it too broad or too limiting, you can unwittingly encourage undesirable behavior. Increasing your deployment frequency can improve the change failure rate since it’s generally easier to test small changes than large ones.
Mean Time to Recovery
Inevitably, despite your best efforts, failures will occur in production. When they do, you’ll want to minimize the delay between a failure occurring and its resolution via a production change. Going back to the classic enterprise model, these large monthly or quarterly releases are often done during the night because if a failure occurs, the size of your changes actually makes recovery more complex and time-consuming – potentially involving activities such as a database backup reindex – so you have to worry about the failure affecting users for a lengthy period of time.
Well-implemented DevOps relies on designing systems for the fastest possible recovery, such as the blue-green deployment model, in which changes are deployed to a subset of your platform (the “green environment”), testing is done, then production traffic is gradually routed from the subset running the current version (the “blue environment”) to the green environment. If failure is detected after deployment, traffic can be easily routed back to the blue environment. Approaches such as these complete the DORA-driven picture by minimizing both the resources needed to recover from a failure and the impact of the failure.
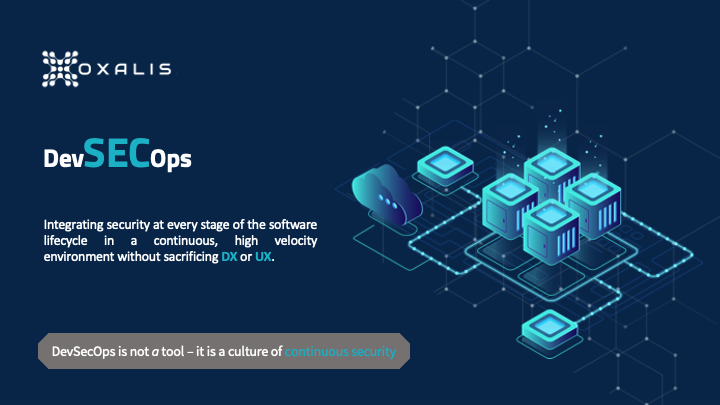
Integrating Security into DevOps
Now we move on to what it means to add Security to the above foundation.
- You want security at every stage of the process, to be something everyone concerns themselves with.
- You want to shift it left so security is thought about early in the cycle.
- You want to preserve DX and UX.
Traditional security tools, time-consuming to use and siloed in a separate security team, won’t suffice. One challenge with DevSecOps is that there’s no single tool or tool collection you can go out and buy that enables you to suddenly be “doing DevSecOps.” But in pursuing the goal of a culture of continuous security, there are tools you can use to integrate security measures at every step in the software lifecycle.
Continuous Security
Remember the 8-stage DevOps infinity model? Software is never developed and then just done – it’s a continuous process. You’re making production changes about as fast as developers are releasing code. So your security checks have to be baked into that process as inherently as code commits are, and baked into every one of the eight steps. This is only possible if everyone takes responsibility for security in the stages they participate in.
Full Lifecycle Security
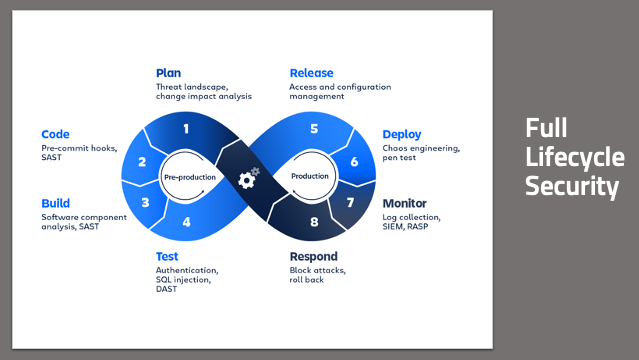
From a planning standpoint, how do you design features that enhance and improve security? You need to think about the threats that a new feature brings to bear on your product, so you can mitigate it in the planning process rather than after it’s already been exploited – and even better, so you can give your developers real-time feedback on potential code issues even as they are writing code. You want to build in a secure manner, pulling in only components that are secure. You want to make sure that your code and your builds aren’t doing anything unexpected or untoward. You want to have confidence that what you build is what goes into production, and that what’s in production behaves as expected. And you want all this automated, with minimal human interaction.
To complete the loop, you want to have the information you’re collecting from your production environments to go right back into the planning process. This gives you a short feedback cycle as you continue to respond and iterate quickly. For those who are new to DevSecOps, and even to DevOps, the big wins come from the code deployment part of the chain, CI/CD steps 2-6. In the monitor and respond steps, traditional cybersecurity tools and approaches can be useful, but only to the extent, they’re integrated into the chain, so they can happen in real-time – rather than having to stop everything and wait for a separate team to do something.
Do Your Threat and Risk Assessments
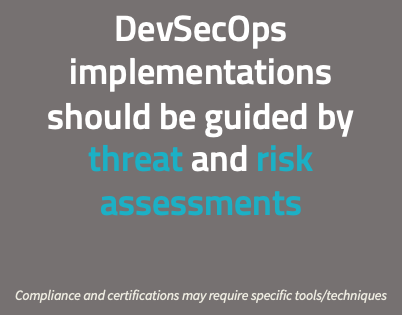
Clearly, every organization is different, and every organization faces a different set of threats and has different concerns when it comes to security. Implementing security measures appropriate for a DevOps model, without sacrificing throughput or stability, is not trivial, and consulting experts is appropriate. There are a lot of standard tools and standard methodologies that can be applied. But it’s vital to ensure that any tools and processes chosen fit your needs well, including accommodating the particular industry space(s) you operate.
You need to do your own threat and risk assessments before any discussion of security tools. If you’re working in the government space, there are compliance and certifications that may dictate security requirements, such as static code analysis. You should be making choices for security without having compliance requirements. That’s definitely the Oxalis position on this. When we work with organizations, we start with such questions as What is the profile that you’re facing? Where’s your organization today? Where do you want to be based on what you’re doing? Where your concerns lie? The answers lead us to determine what will give you the best bang for your buck in the DevSecOps space.
The Foundation of DevSecOps
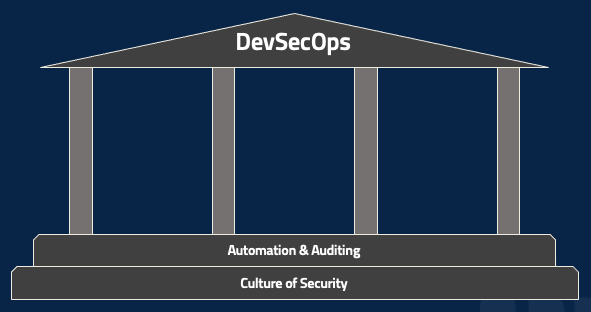
There are, however, two foundational pieces that are required for DevSecOps in all cases. The first, as mentioned earlier, is a culture of security, which underlies everything. While there’s certainly a role for dedicated security folks, DevSecOps requires security to be part of everyone’s job and of the entire organization’s culture. Product management, project management, coding, testing, deployment, network monitoring – everyone. The second part of the foundation is automating every possible action and then auditing the performance of that automation. Regardless of your role, ask yourself how to take a particular tool or tactic and automate it. Then whenever the automation runs, for good or bad, make sure that there’s a clear, indelible record of it. A fully-automated lifecycle can be a nightmare if you have no easy way of determining why it’s malfunctioning.
You can take these steps whether you’re just starting – maybe figuring outsource control and experimenting with some automated builds – or working in a mature enterprise environment. And without them, the following tools and tactics will be minimally useful.
DevSecOps security best practices: Three Areas of High Value
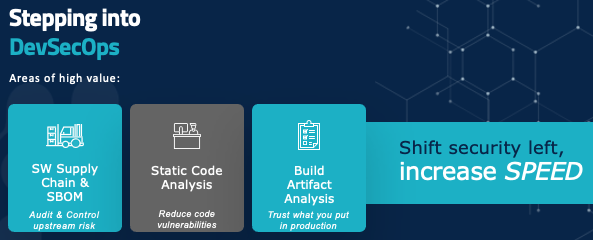
Let’s start talking about some actual tools and tactics that your organization can consider.
On your path to shift security to the left and increase speed, there are three major areas to focus on: auditing and controlling upstream risk and communicating that downstream, giving developers real-time tools and feedback so they know they’re writing code in a secure manner, and making sure that what you’re building is something you can trust in production.
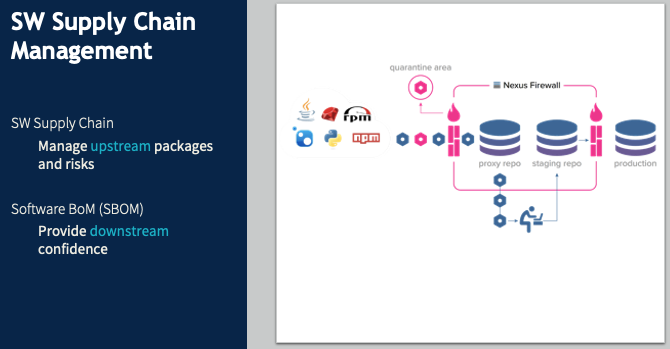
Software Supply Chain
Software supply chain management is a hot topic at the moment. In December 2021, Oxalis spent a lot of time tracking and navigating the Log4j risk. Log4j, an almost ubiquitous Java component, has been around for decades before a major vulnerability was detected, with active exploits being run against it. Without functional software supply chain management, many organizations had no idea what their Log4j vulnerabilities were – which products had incorporated this component, or which internal tools or software used it.
Say I, as a software developer, don’t want to write my own tool to log errors because I know that’s a common component someone else has surely created. And there’s this great one called Log4j. It’s freely available, it’s in a Maven repository, so I just pull it into my code and start using it. And suddenly, I have introduced an unmanaged risk into the product – and into the company. No one else has any idea that component is being used, so no one else has a chance to anticipate problems or mitigate them if they happen.
In a DevSecOps environment, when I identify the need for a logging package and want to use Log4j, I poll my internal security repository. If Log4j is whitelisted, it gets pulled right in with no problem. Maybe it’s listed as iffy, so I can still add it, but the security team gets notified to inspect it. If it’s blacklisted, it just gets blocked. This approach does two key things.
- It provides a clear point of audit since there’s a central repository of all external components used by our products and tools. And since we want to automate as much as possible, this repository can be used by a threat monitoring system that automatically notifies us of our risk points when a new vulnerability is discovered.
- It prevents attacks such as the NPM supply chain attack of March 2022. When you’re pulling a library from a public repository, you might mistype the name of the library and not notice that there’s a package for that library – a bogus package containing a threat (this is called typosquatting). We want that library request to go through our security repository and be blocked.
So far we’ve been looking at the upstream side. Software BOM covers the same process downstream. You want to put together a list of every component that goes into a piece of software, and ensure it follows the software through the rest of the lifecycle. This will soon be required for federal contractors. There are plenty of tools for this, but they’re language-specific and rapidly evolving. If you have any questions about your specific case, get in touch with us, and we’ll help you navigate it.
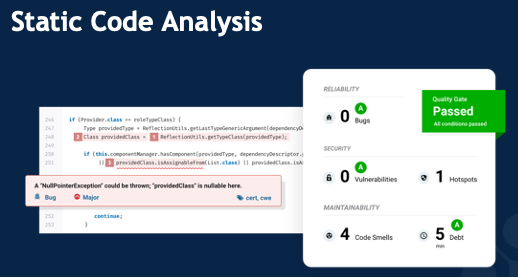
Static Code Analysis
It’s exceedingly rare for an employee to intentionally introduce a security vulnerability. The major risk is accidental coding errors, such as the classic buffer overflow, in which (for example) the code implicitly assumes a particular list will be at most 10 items long. If an attacker finds a way to make an 11-item list, they’ll have broken into the system in some way, shape, or form. The common cross-site scripting attack often relies on code that fails to clean up user inputs, allowing characters that can be used for all sorts of harmful activity.
Static code analysis tools look for these types of errors (including, of course, far more sophisticated and subtle cases than buffer overflows) and provide real-time feedback to developers that they could be introducing security risk, as well as preventing that code from reaching production. These tools often use manual rules for identifying these errors, but are increasingly relying on AI and machine learning to identify those really subtle vulnerabilities that even a conscientious developer might not catch on their own.
Build Artifact Analysis
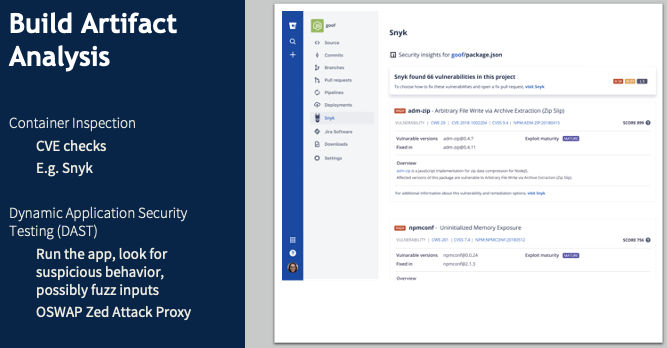
Now you’ve verified external dependencies and inspected your code for even subtle vulnerabilities. How do you check the results of the build to make sure they are what you expect to be flowing down into production? If you’re using a containerized application – taking what amounts to a VM image from the internet and putting it into your production environment – how can you be confident you’re not introducing some security vulnerability or an unpatched piece of software? Build artifact analysis relies on DAST tools to identify these risks, monitoring for unexpected external server traffic or unusual memory usage, or unauthorized file access.
Traditional Integrated CI/CD Pipeline
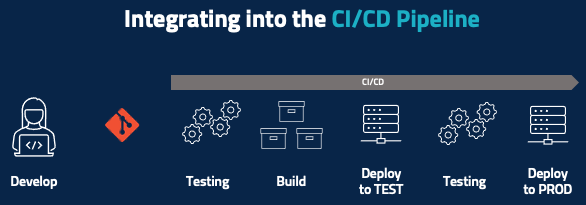
Now it’s time for a closer look at the test-to-deployment portion of the lifecycle, starting with the traditional CI/CD pipeline looks like after the developer develops their code and pushes it to, say, a Git repository. Some amount of automatic testing happens at a code level, unit testing happens here, and maybe there’s some basic code inspection. You then run the build and then deploy that piece of code – or maybe deploy the entire product into a testing environment where you run some integration tests. If all the testing passes, then you deploy to production.
Integrating Security into the CI/CD Pipeline
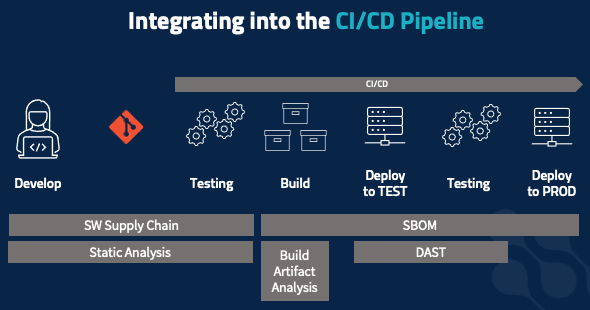
All the security elements we’ve covered need to be integrated into the pipeline. When working on code, you should be receiving real-time feedback, not from the testing stage later on. Static code analysis and software supply chain management apply here – is the package you’re adding allowed? Am you at risk of introducing security vulnerabilities? Those same tools and tactics extend into your static testing phase, to check for vulnerable upstream packages and security code violations that you don’t want to get intoy our production environment. The build process is also where you develop your software BOM, to document everything that’s going into the build as an immutable record that follows the build all the way into production.
Build artifact analysis happens in two stages, starting at build time. Inspect your containers: are you pulling in containers that have, say, a version of SSH with an unpatched vulnerability or a bad root password set. Do your dynamic application testing: check for outbound connections, check unexpected file access, etc. You often do this in your testing environment. But your risk profile might dictate that you do this in a more isolated way, to maximize confidence that the application is behaving as expected and to minimize unexpected risks that might bite you when you go into production.
Sample DevSecOps Toolchain
There are, of course, many different tools that fit the scenarios mentioned here, and what’s right for your organization will vary. Here is a set we have found to work for a broad customer base, as a concrete example of what this all can look like. But your threat profile and risk profile, and the type of software you’re developing, where your organization is cultural – all dictate which products you’ll want.
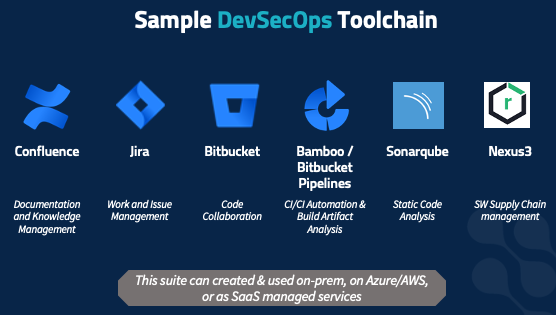
This set of tools is flexible and fits a wide range of customer profiles as well as a variety of software development methodologies. It covers every part of the 8-step infinity model.
Oxalis has deployed this suite repeatedly for many customers, and helped train developers in it. We value it not just for its flexibility, but because it can be deployed on-prem, in your server closet, in your VMWare cluster, on Azure or AWS both in commercial space and in sovereign high-compliance spaces such as AWS Gov Cloud. In addition, these solutions are all available as SaaS-managed solutions, if your risk profile supports using a third-party managed solution. We’ve deployed this stack to all those scenarios – and we use it internally as well.
How to Get Started with DevSecOps Security Best Practices
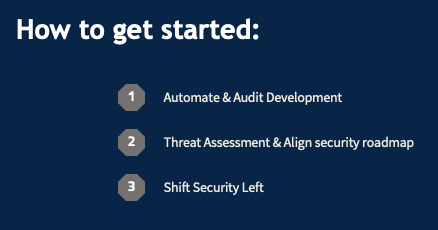
1) The core of everything you do. Using Sonarqube to crank out error messages does you no good if you can’t figure out which developer wrote the code generating the messages so you can catch it earlier in the future. If it’s not happening automatically, it’s probably not happening at all or is consuming huge resources on it and it’s probably slower too. So again, you want to move fast, with frequent code deployments.
2) Understand this and align it with what you want to do on a roadmap basis. We can provide guidance and support on this. We don’t want anyone to add static code analysis just to check a box. It needs to be a specific response to your analysis of your organization’s security risks and concerns.
3) Break down silos. Get security out of the tail end just before release, and into the planning, early development, and architecture stages. You want security at each step in the lifecycle so that if one step fails, the next can catch it and prevent customer impact.
You develop your own software, and Oxalis helps companies who develop software with their work management tools. We’re excited to discuss this with you and hear about your concerns. Even if you’re just getting started on your DevOps journey or taking your first steps into CI/CD, we can provide guidance.
Recommended blog posts about DevSecOps security best practices
Contact Us
Do you have questions about DevSecOps Security best practices?